...
We first plotted the zonally average temperature as shown below:

Note that the temperature gradient is stronger during winter (January in the Northern Hemisphere and July in the Southern Hemisphere). The sloping temperature surfaces shown are analogous to the sloping density surfaces we observed in the tank experiment in our study of fronts.
...
Source: http://visibleearth.nasa.gov/view.php?id=56236
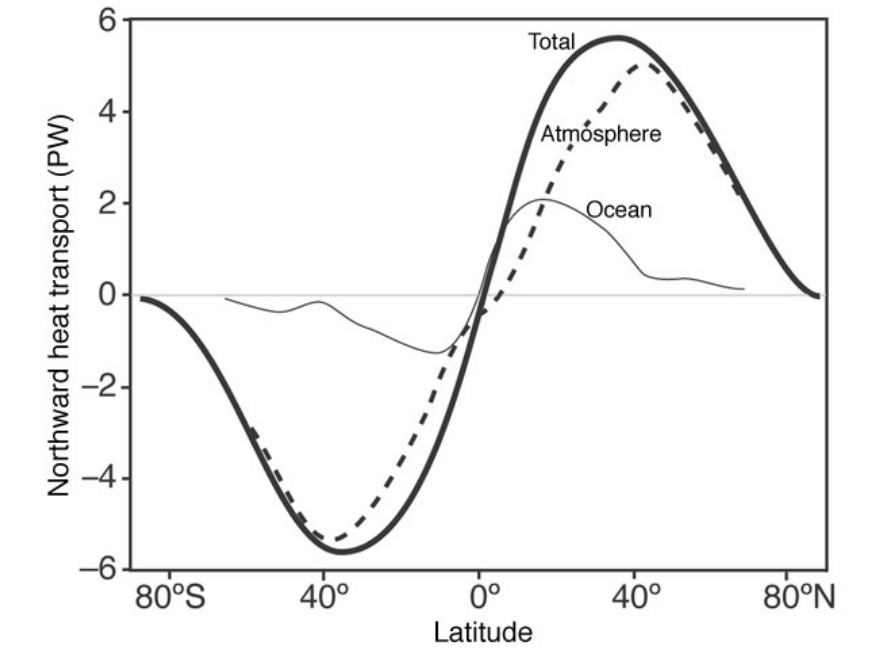
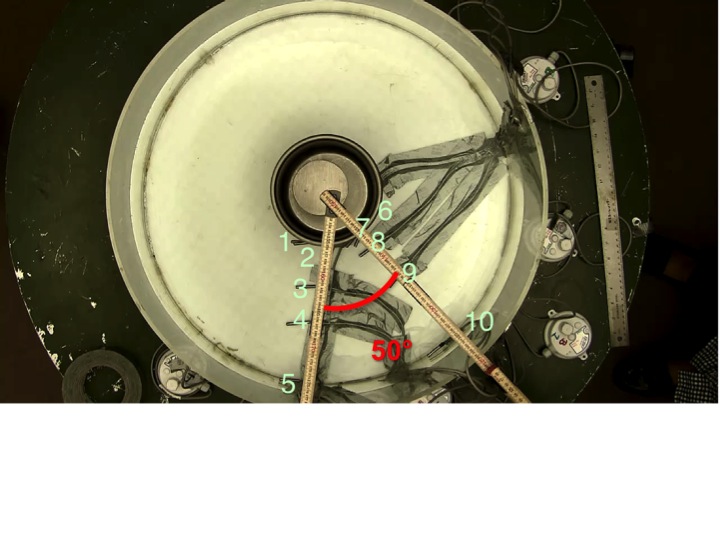
The midlatitude eddy circulation, which we can observe surrounding the pole in the satellite image above, is important for heat transport in the atmosphere. Eddies occur at higher latitudes than the Hadley Cells and as the plot above shows, estimates as in the plot above show, are responsible for most of the heat transport required by the differential heating of the Earth. Once again we used a tank experiment and atmospheric data to study these eddies. Since eddies occur in the midlatitudes, the Earth’s rotation more strongly affects motions in these eddies than the Hadley Cell motions near the equator. Therefore, to mimic eddies in our tank experiment, we used a high rotation rate and temperature gradient. To study eddies in the atmosphere, we used atmospheric data to study the heat transport involved in the midlatitude eddies.
...
...