...
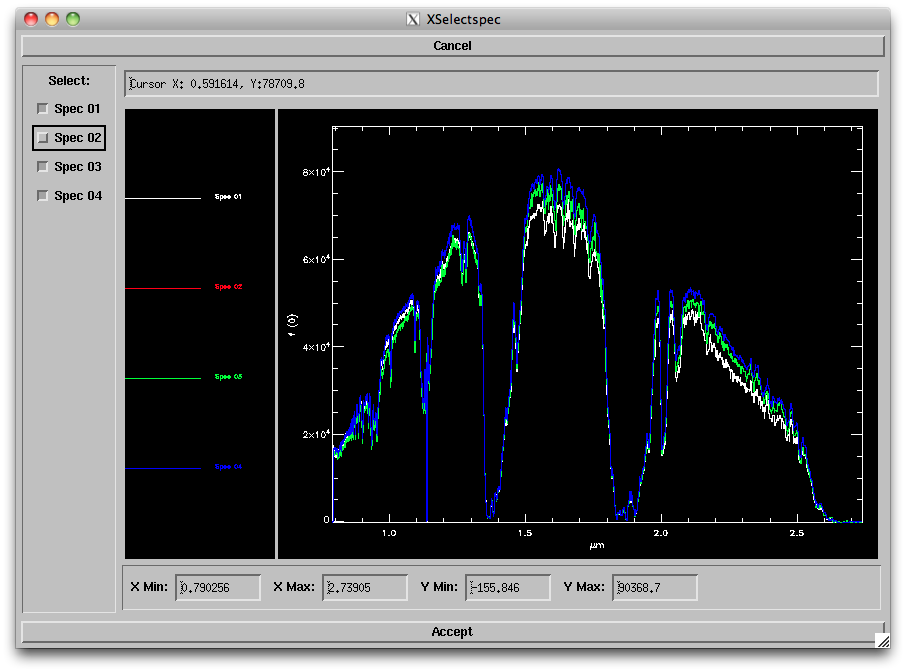
- Scale: Selecting this and Order '00' will bring up a new window (left panel below) allowing you to relatively scale the spectra either to a median value between the data or scaling to a selected spectrum (e.g., the highest S/N spectrum). The routine sets the scaling in the region indicated by the blue dashed lines; you can change these by pressing "s" and then clicking on the left and right sides of the region you want to use. You can also change the horizontal and vertical ranges of the plot to zoom in on particular regions. Select one of the scaling options to set the scaling, then click "Accept" when you are satisfied with the scaling.
- Remove: Selecting this option and Order '00' will bring up a new window (middle panel below) allowing you to choose a spectrum to reject (e.g, in case of bad S/N). Simply uncheck the spectrum you want removed. Alternately you can modify your input list of files to reject that spectrum. Click on "Accept" when done.
- Correct Shape: This option automatically determines a wavelength-dependent scaling factor to each spectrum to correct to a common shape. This was originally designed to handle slit loss errors for bright standard stars. It is strongly recommended that you use this option be used sparingly and only on for bright sources.
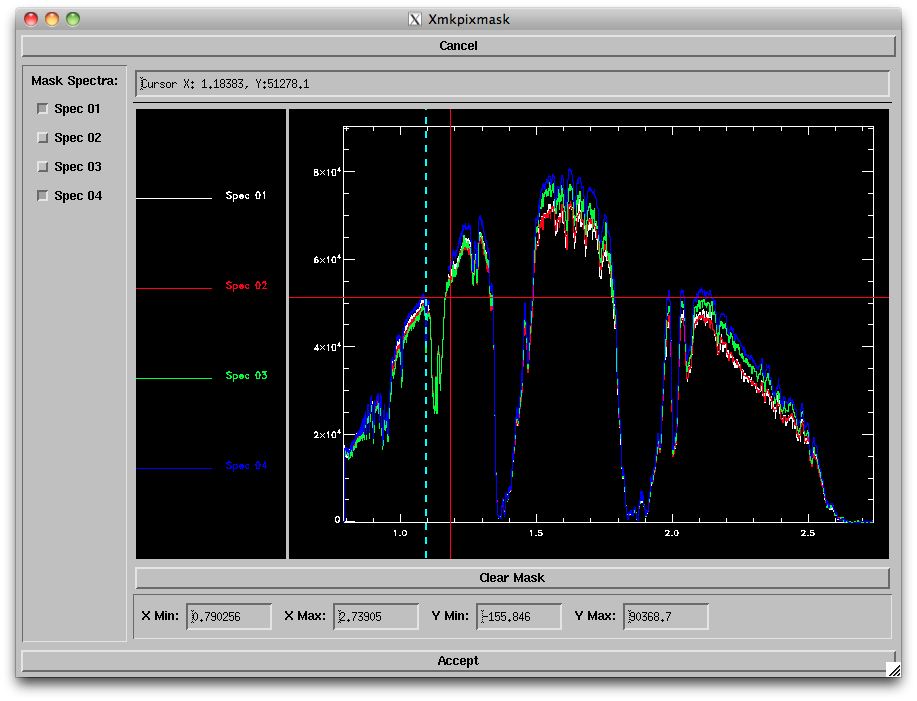
- Mask Pixels: Selecting this option and Order '00' will bring up a new window (right panel below) allowing you to select a region and spectrum to mask out. You can zoom in on a given region by changing the plot ranges at bottom or typing "z" and clicking on the lower left and upper right corners of the area you want to zoom in on ("w" bring you back to the full plot range). To choose a region to be masked, type "s" and click on the left and right ends of the range you want to mask. This will reject that region from all spectra; to bring back the "good" spectra, uncheck the boxes on the left side of the window. Repeat for all bad pixel regions; you can click on "Clear mask" to start over. When satisfied, click "Accept".
Screen shots of the secondary windows for (left) scaling spectra, (middle) rejecting spectra and (right) masking pixels.
3. Next, choose the statistic to use for combining the spectra. There are several options available; the default (Robust Weighted Mean) tends to provide the best results for more than 4 spectra of reasonable S/N.
...


