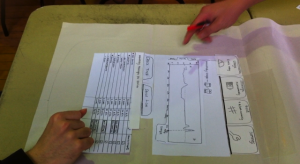
In round 2 we added a "sell power" button to each device. |
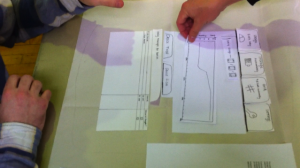
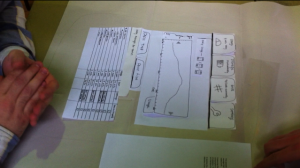
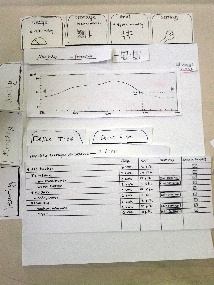
Figure 2.1: Storage view
The image above shows the storage view in round 1, before the "sell power" button was added for each device in the table.
| 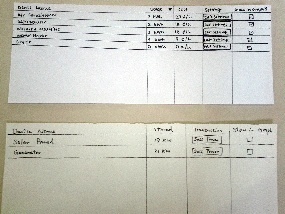
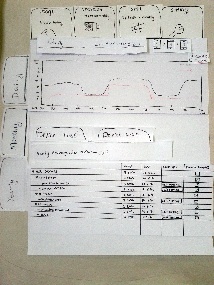
Figure 2.2: Storage device table vs usage device table in round 2
The image above shows the device tables for "storage" (on the bottom) view and "usage" view (the top table), illustrating the similarity between the two tables.
|
Other
Round 1: setpoint and transaction scheduling
Round 2: new graph specific features added before round 2
| 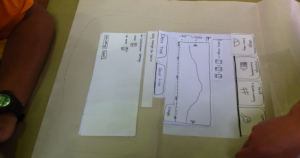
Figure 5.1.1: Setpoint
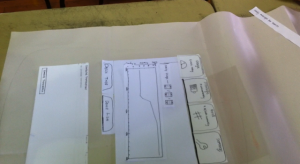
Figure 5.1.2: Scheduling transactions | 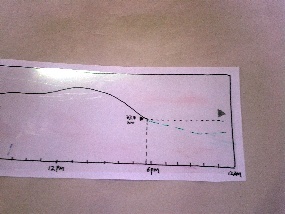
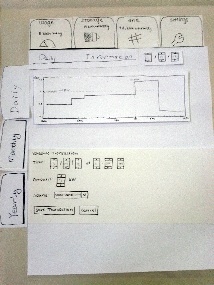
Figure 5.2.1: Power usage estimates
The green dashed line in Figure 5.2.1 above, shows the estimated power usage.
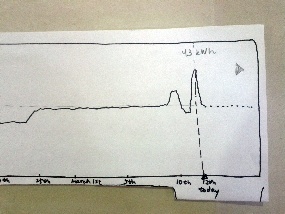
Figure 5.2.2:
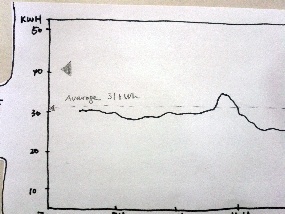
Figure 5.2.3:
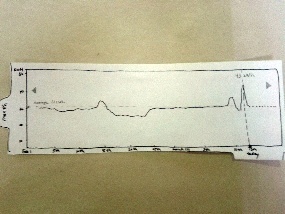
Figure 5.2.4:
The images above show the graph changes we made for round 2.
|