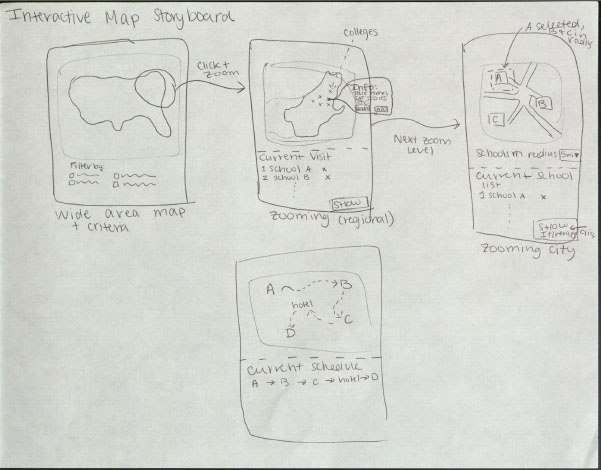
This interface is much more visual and allows Mrs. Black to immediately zoom in to the specific areas that she is interested in, while filtering for Rebecca's interests and qualifications for the college process. The first map allows Mrs. Black to begin selecting important features and zoom and select a region of interest. Once she has selected the New England area as her first area of interest, she could zoom further or begin to see schools represented as pins in the map. When clicked on each of these colleges a description will be pulled up with important statistics (e.g. average SAT scores/GPA of admitted students) and key tour times that might be necessary for planning to a visit. As she inspects schools Mrs. Black can decide to add those schools to her current selections or go back to searching other schools and clicking on other pins in the map. Since Rebecca is particularly interested in urban schools, eventually Mrs. Black can zoom in to the city level and just look closely at the Boston schools she as selected on a map. In the final screen Mrs. Black can see the generated itinerary with a map view showing the route from one school to the next (to stay consistent with the overall map interpretation of the problem). |