...
In this plot of potential temperature, we see evidence of fundamentally warmer air over the equator (indicated by the red vertical line). Note how the temperature gradient varies between January and July. The gradient between the equator and the north pole is much less pronounced during July.
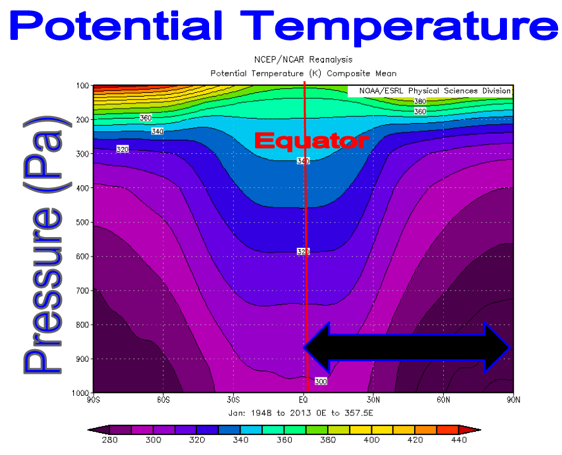
(Climatological plot of January 1948 to 2013)
Poleward movement of fluid can is observed the following plot of zonally averaged Meridional Wind Flow. Note the surface divergence at 30 N and 30 S, where sinking air at the edge of the Hadley circulation encounters Earth’s surface.
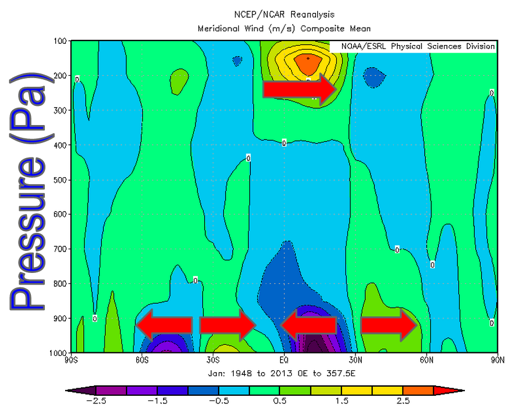
(Climatological plot of January 1948 to 2013)
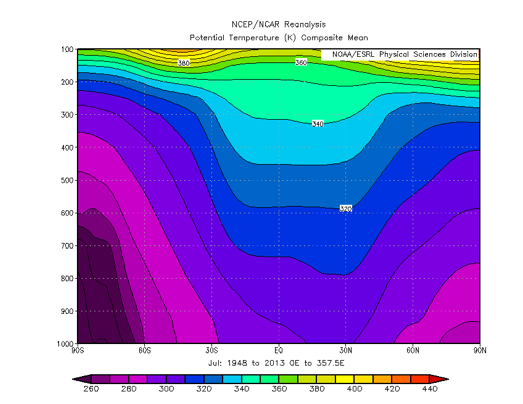
(Climatological plot of July 1948 to 2013)
In July, the surface divergence at 30N becomes significantly weaker. The divergence at 30S appears to significantly stronger.
...