| Background Color |
|---|
| New Features in | | Wiki Markup |
|---|
{bgcolor:E6E6FA}
h2. New Features in 6.2.1 {bgcolor}
{bgcolor:E6E6FA}
h3. Setting Page Breaks {bgcolor}
1. Go to 'Questions'
2. Select !split_section.jpg!
\\ !questions.jpg!
*Batch Add Page Breaks*
1. Go to 'Questions'
2. Select 'Set Page Breaks'. This will put each question on a separate page.
h3. Removing Page Breaks
*Batch Remove Page Breaks*
1. Go to 'Questions'
2. Click 'Remove Page Breaks'. This will remove all page breaks in a survey.
{bgcolor:E6E6FA}
h3. Publishing a Survey {bgcolor}
1. Click the 'Publish Survey' link.
!nav.jpg!
2. There are several ways to publish and send the survey to respondents:
* Send the link on the 'Publish Survey' page.
* Use invitations to automatically send an email to all respondents on the invitee list. For more information on invitations, see the Invitations video [here.|http://web.mit.edu/stellar-help/survey_startpage.html]
* Print the surveys using the 'Print Survey' link on the 'Publish Survey' page.
h3. Checklist before Publishing a Survey
* Survey has been tested (especially branch conditions, if any)
* Survey open dates are set
* Survey is unlocked (green light on the survey admin screen)
{bgcolor:E6E6FA}
h3. Reports and Data {bgcolor}
Reports are automatically created when people start responding to a survey. There are two reports, "Comment' and 'Summary' reports. The 'Comment Report' displays all of the responses given for all open-ended question. 'Summary Reports' show the data for respondents for all questions.
{Note:title=To view each respondents answers individually, go to 'Manage Responses' under 'Reports and Data' and click on a respondents ID}
Reports come in many different formats:
* PDF - creates a PDF document of the data.
* HTML - identical to PDF except it is opened in a webpage.
* Raw Data - does not include charts and calculated data like the PDF and HTML reports. Can be opened in Excel.
* SPSS - exports in the SPSS format to be used with an SPSS program.
|
| Background Color |
|---|
| Setting Page Breaks |
1. Go to 'Questions'
2. Select  Image Added Image Added
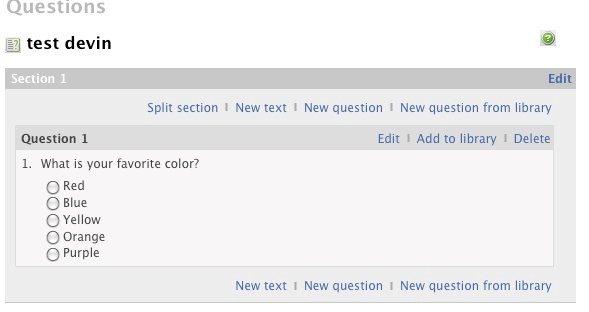 Image Added Image Added
Batch Add Page Breaks
1. Go to 'Questions'
2. Select 'Set Page Breaks'. This will put each question on a separate page. Removing Page BreaksBatch Remove Page Breaks
1. Go to 'Questions'
2. Click 'Remove Page Breaks'. This will remove all page breaks in a survey. | Background Color |
|---|
| Publishing a Survey |
1. Click the 'Publish Survey' link.
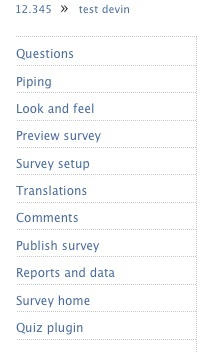 Image Added Image Added 2. There are several ways to publish and send the survey to respondents: - Send the link on the 'Publish Survey' page.
- Use invitations to automatically send an email to all respondents on the invitee list.
- Print the surveys using the 'Print Survey' link on the 'Publish Survey' page.
Checklist before Publishing a Survey- Survey has been tested (especially branch conditions, if any)
- Survey open dates are set
- Survey is unlocked (green light on the survey admin screen)
| Background Color |
|---|
| Reports and Data |
Reports are automatically created when people start responding to a survey. There are two reports, "Comment' and 'Summary' reports. The 'Comment Report' displays all of the responses given for all open-ended question. 'Summary Reports' show the data for respondents for all questions. | Note |
|---|
| title | To view each respondents answers individually, go to 'Manage Responses' under 'Reports and Data' and click on a respondents ID |
|---|
| | |
Reports come in many different formats: - PDF - creates a PDF document of the data.
- HTML - identical to PDF except it is opened in a webpage.
- Raw Data - does not include charts and calculated data like the PDF and HTML reports. Can be opened in Excel.
- SPSS - exports in the SPSS format to be used with an SPSS program.
|