...
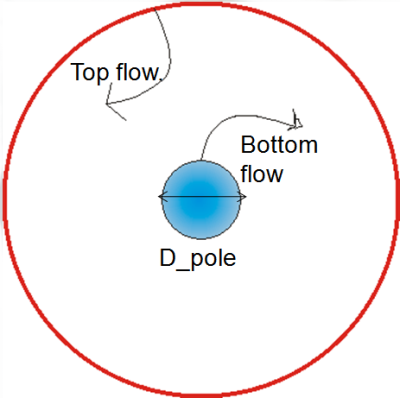
The temperature forcing wants to bring warm water inwards in our experiment (warm air/water polewards in the real atmosphere/ocean) and cold water outwards (equatorwards). For low rotation rates (small f), the Rossby radius is much smaller larger than the circumference of our tank (a latitudinal circle in the atmosphere). In this case, the circulation is symmetric with respect to the pole and cold fluid flows inward on the bottom and gets deflected to the right resulting in anti-cyclonic motion. Warm fluid moves outward on the top, gets deflected to the right and results in anti- cyclonic motion. This circulation is analogous to the Hadley circulation in the low latitude atmosphere. A sketch of the deviation of the moving fluids can be seen in the following sketch:
...
You can find our experimental setup description here: Experimental Setup for General Circulation - Experiment Tips(Wilken & Julian)
Hadley Regime f=0.1s^-1
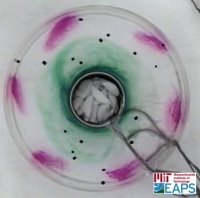
We have used a rotation rate of f=0.1s^-1. Here we present a top view onto our experiment. Turn on your computer's volume as we have commented the video!
 http://www.youtube.com/watch?v=olKFj6g-nPw&feature=channel&fmt=18
...
Wilken-Jon von Appen (wilken (at) mit (dot) edu) and Julian J Schanze (schanze (at) mit (dot) edu)Experimental Setup
In the following picture you can see our experimental setup:
We have used the big rotating tank that the GFD Laboratory at MIT supplies. On top there is a co-rotating camera which gives us videos in the rotating frame of reference. Onto the rotating table, we have placed a big white piece of paper. The reason is that the tanks we are using have transparent bottoms. Without the white paper, we would see the green color of the rotating table in the background of our top videos and that would significantly lower the visibility of different dye colors used to visualize the flow.
On top of the paper, we have placed a large square tank (side-length of 60cm), into it a smaller circular tank (diameter 44cm), and into that a metal can (diameter 12cm). The outer tank is filled with warm water (21°C) representing the warm equatorial regions of the earth while the metal can is filled with cold water and ice (at a constant 0°C). Roughly every 20 minutes throughout the experiment, we sucked some of the cold water out of the can and refilled some ice to keep the temperature. The outside water bath dropped by less than 2°C throughout the entire experiment which was sufficiently constant for our purposes such that we did not adjust it.
In the inner tank was the fluid representing the atmosphere. Since we were interested in the temperature distribution in that fluid, we placed six temperature probes in it: one on the bottom and one near the surface each close to the can, half-way between the can and the outside tank, and near the outside tank. You can see our poster taped construction here: