Introduction
By Sheila Xu and Costa Christopoulos
There are two "ingredients" needed for weather on Earth:
...
The process of the gain and loss of solar heat sets up a general circulation pattern where the warm air parcels rises near the equator, flows away from the equator until the 30 degrees latitude, sinks near the poles, and the flows back to the equator.This process is called Hadley Circulation.
The air is parcels are not able to move beyond the 30 degrees latitude due to the conservation of angular momentum, especially the zonal velocity of the air must increase. The Coriolis effect is small.
...
In order to visualize the Hadley Circulation, a rotating tank experiment was set up. We define Hadley Circulation as a "low rotation" experiment since the effect of Earth's rotation is small. Place a bucket of ice in the center of the tank, which will represent the cold poles. Make sure to measure the mass of the ice beforehand (Our mass of ice was 675 grams). The equator will be represented at the edge of the tank, since it is warmer than in the center of the tank. Then, place eight thermometers in the tank to get data on temperature gradient inside of the tank. The set-up is shown as below:

(Top-view of the tank set-up)

(Side-view of the tank and thermometers placement) (Christopoulos, 2014)
...
Note that the tank moves in counterclockwise motion in the image below. The crystals move in clock-wise motion, opposite of the tank rotation, but the blue dye moves in the direction of the tank rotation. The crystals represent "Easterly wind" and the blue dye the "Westerly wind."


Note how the cold water would slowly move out from the center at the bottom (such as Blue #1, #2) and the eventually, the temperature of the outermost thermosisters would drop. The trend of the graph clearly decreases over time. There are minor "bumps" in the graph, which could be attributed to the rotation of the tank.
Then, we used the thermal wind equation for water, since water in the tank is an incompressible fluid:

where Ω = 0.1046 rad/sec, α = 207 * 10^-6^ K^-1, and dT/dr = 35.7 C/m. du/dz ended up to be 0.34 s^-1 from those values. The surface velocity was 0.054 m/s. The Hadley circulation is axisymmetric, especially in due to thermal wind balance with the radial temperature gradient.
Atmospheric Examples
Eddy Circulation
Eddy Circulation
Eddies are formed at high rotation rates and at middle to high latitudes. Coriolis forces have more effect, in this case. Due to the rotation, the Coriolis forces overpower pressures from temperature gradients, so the Hadley circulation breaks down. However, the heat must be transported from the tropics to the sub-tropics and the poles:

(Source: http://paoc.mit.edu/12307/gencirc/climatology_lab.pdf)
This can be explained by the conservation of angular momentum. When air parcels move to the higher latitudes, their zonal velocity must increase and their radius of their paths must decease to conserve angular momentum.
Tank Experiment of Eddy Circulation
The tank experiment of eddy circulation is similar to the set-up of Hadley circulation. We define eddy circulation "fast rotation." Thermometers are placed a little differently than the set-up of Hadley circulation:

(Side-view of the tank and thermometers placement) (Christopoulos, 2014)
Another difference is that red and blue dye are used to observe the motion of cold and warm water in the tank. Blue dye is placed closer to the ice bucket while red dye is placed closer to the edge of the tank ("equator"). A series of images below show an evolution of the eddy circulation:


The rotation rate was set to 10 rpm. The bucket of ice contained a mass of 1200 g. Note that the red currents transport energy to the center.
The results from the thermometers are shown in the graph below:

There are larger temperature fluctuations, much more than the graph of the Hadley circulation tank experiment. This can be explained by the currents of the cold and warm water mixing. We estimated the fluctuation in the graph to be of an amplitude of 1 Celsius. Then, we calculated the radial heat flux so we can see the flow of heat into ice:

The power required to melt the ice is the latent heat of the ice times the amount of ice, divided by the amount of time it took for the ice to melt. L = 333 KJ/kg, m = 1.2 kg, t = 27 min (1624 sec), which came out to 0.2 kJ/s (200 Watts).
However, we also want to see how much of heat was transported by the eddies:
The area of the cylindrical surface at radius of 10 cm was 0.1 m^2. The velocity was .005 m/s. Using those values, the heat flux came out to 0.3 kJ/s (300 Watts).
The values of the fluxes, 200 Watts and 300 Watts, are close to each other even though the values are different (as long they are in the same order of magnitude).
Atmosphere
As in the tank experiments, two regimes of circulation and energy transport are observed on earth. Differential heating takes place between the Earth’s equator and the poles. This differential heating sets up a large scales circulation pattern which is affected by Earths rotation.
In the tropics, the Coriolis parameter is relatively small and the influence of Earth’s rotation is weak. In this regime, the Hadley circulation prevails, transporting energy from the equator to a latitude of roughly 30N. As air over the equator warms, it begins to rise into the upper atmosphere. It than diverges poleward, acquiring angular momentum as it travels to higher latitudes. At the edge of the Hadley cell (30N) the air sinks to surface and begins to travel towards the equator again. Evidence of the Hadley circulation can be observed in the following NCEP reanalysis plots. The plots can be found at: http://www.esrl.noaa.gov/psd/cgi-bin/data/composites/printpage.pl
In this plot of potential temperature, we see evidence of fundamentally warmer air over the equator (indicated by the red vertical line). Note how the temperature gradient varies between January and July. The gradient between the equator and the north pole is much less pronounced during July.
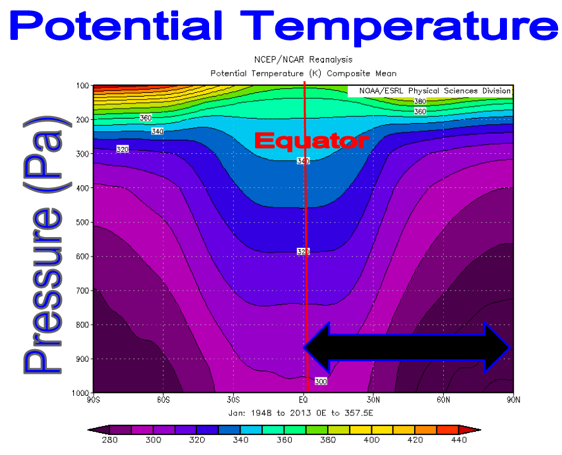
(Climatological plot of January 1948 to 2013)
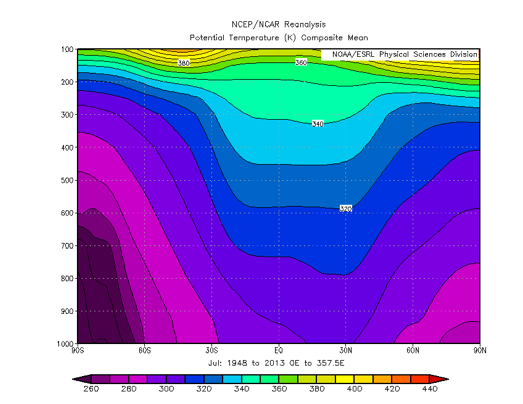
(Climatological plot of July 1948 to 2013)
Poleward movement of fluid can is observed the following plot of zonally averaged Meridional Wind Flow. Note the surface divergence at 30 N and 30 S, where sinking air at the edge of the Hadley circulation encounters Earth’s surface.
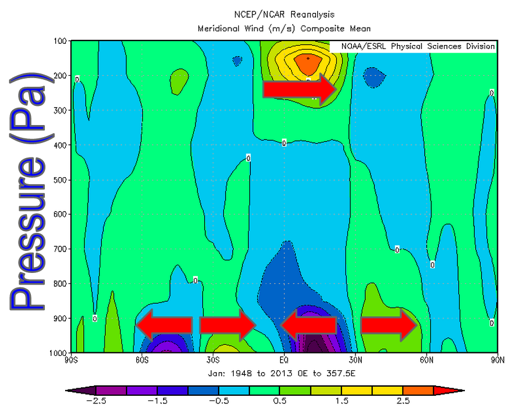
In July, the surface divergence at 30N becomes significantly weaker. The divergence at 30S appears to significantly stronger.
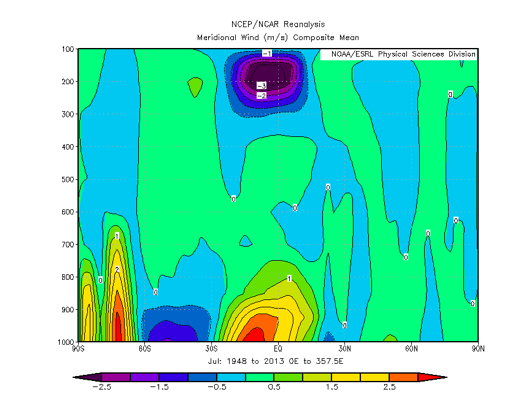
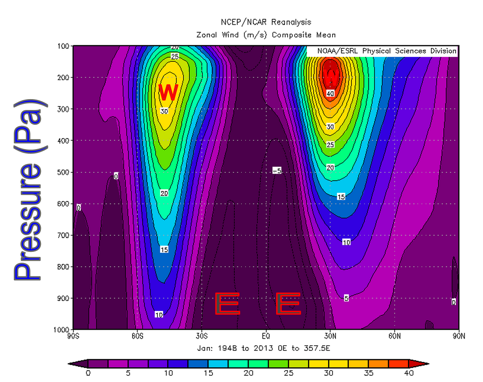
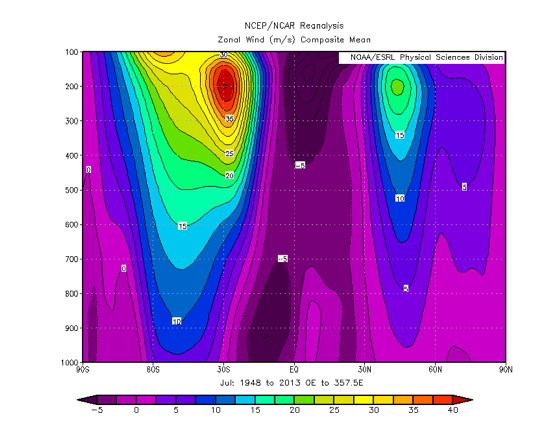
As air parcels travel poleward, they are deflected by the Coriolis force. Furthermore, these parcels acquire a certain amount of angular momentum as they move closer the Earth’s axis of rotation. This deflection leads to the formation of a narrow stream of air at around 200 mb known as the jet stream (marked with ‘W” below). At the surface, parcels bound for the equator are steered right, forming surface easterly winds (marked with “E” below).
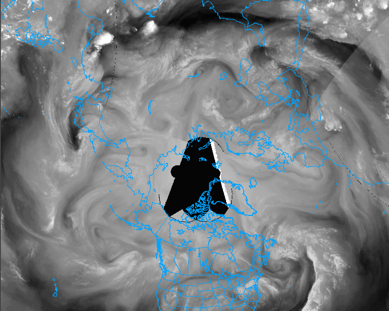
In the midlatitudes, atmospheric circulation is greatly influence by the earth's rotation. In this regime, the Rossby number is higher (relative to the Rossby number at the equator). The primary method of heat transport in this regime are eddies. These eddies make up what are known as mid-latitude weather systems. Below is a water vapor satellite image of the north pole on May 23, 2014 (found at http://climate.cod.edu/flanis/satellite/polar/index.php?type=polar-wv-48). The swirling eddies can very easily be made out.