Prototype Photos
...
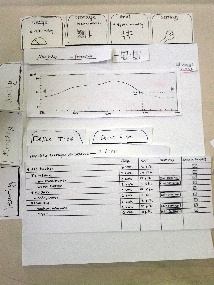 Image Removed
...
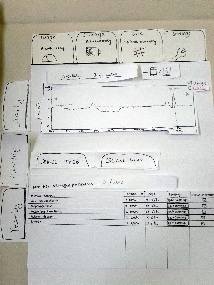 Image Removed
...
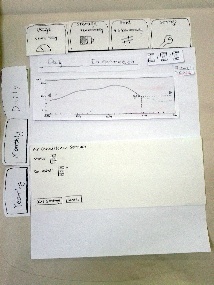 Image Removed
...
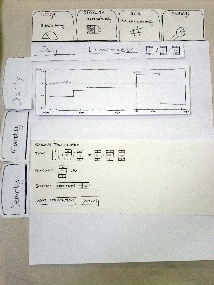 Image Removed
...
| Section |
|---|
|
| Column |
|---|
| Image Added |
|
...
usage with device tree (task 1). Graph is zoomed and dotted line shows predicted usage. |
| Column |
|---|
| Image Added
Viewing power |
|
...
usage with device list (task 1). Graph is in default state, showing monthly usage. |
| Column |
|---|
| Image Added
Changing device settings (task 2). Dotted line shows predicted usage after saving new settings. |
|
...
| Column |
|---|
| 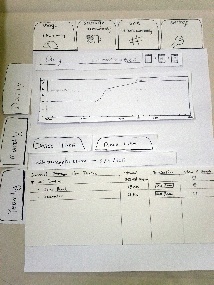 Image Added Image Added
Viewing stored power with device tree |
|
...
...
Graph shows daily storage. |
| Column |
|---|
| Image Added
Selling power |
|
...
...
Graph shows grid pricing information. |
|
Briefing
The purpose of the application is to use emerging Smart Grid technologies to help home users manage their electrical devices more efficiently – reduce energy consumption, lower cost, and make profit.
...
| Round 1
| Round 2
|
|---|
Device tree tab selected
Usage tab selected |
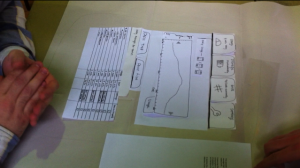
Figure 1.1: Daily view
| 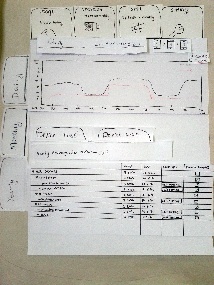
Figure 1.2: Yearly view |
In round 2 we added a "sell power" button to each device. |
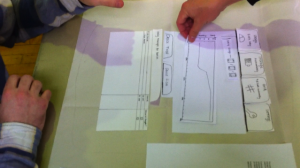
Figure 2.1: Storage view
The image above shows the storage view in round 1, before the "sell power" button was added for each device in the table.
| 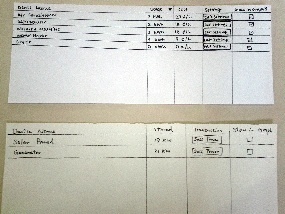
Figure 2.2: Storage device table vs usage device table in round 2
The image above shows the device tables for "storage" (on the bottom) view and "usage" view (the top table), illustrating the similarity between the two tables.
|
Transaction scheduling
|
Figure 3.1: Transaction scheduling 1
| 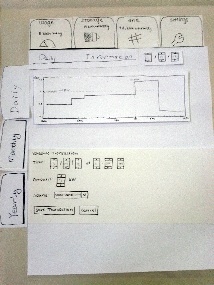
Figure 3.2 Transaction scheduling 2
|
Monthly view
|
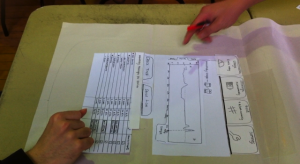
Figure 4.1: Monthly view 1
|
Figure 4.2: Monthly view 2
|
Other
Round 1: setpoint and transaction scheduling
Round 2: new graph specific features added before round 2
| 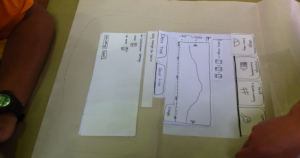
Figure 5.1.1: Setpoint
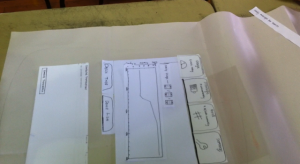
Figure 5.1.2: Scheduling transactions | 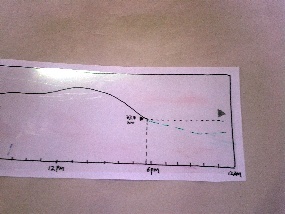
Figure 5.2.1: Power usage estimate for today
The green dashed line in Figure 5.2.1 above, shows the estimated power usage for the next 6 hours (based on grid pricing and previous usage patterns).
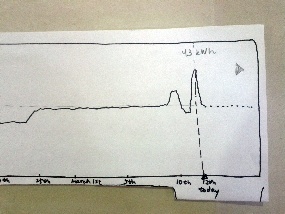
Figure 5.2.2: Power usage estimate for this month
The dotted line in figure 5.2.2 shows the predicted usage values for a short period after the current time.
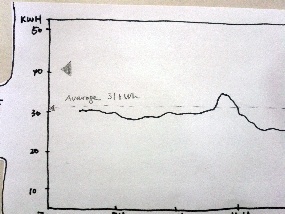
Figure 5.2.3: Graph average
Figure 5.2.3 above shows the horizontal dotted line with a label showing the average for the graph, as described in the "Between Round 1 and Round 2" section.
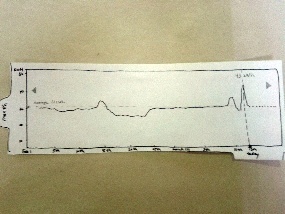
Figure 5.2.4: Graph average and power usage estimate
The images above show the graph changes we made for round 2.
|
After Round 2 - Prototype Pictures
The table below shows the changes we made based on the user feedback in Round 2.
Changes | Round 2 | After Round 2 |
|---|
Changed the caption and the icon of the Grid tab to Sell Power and a $ sign, so users without smart grid knowledge can easily understand it.
| 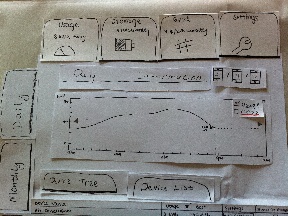 Image Added Image Added
Figure 6.1.1 - The third tab at top is named Grid | 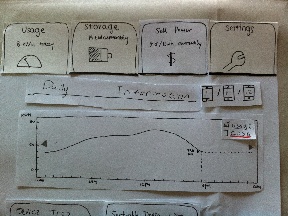 Image Added Image Added
Figure 6.1.2 - The tab is renamed to Sell Power |
Renamed the Device List tab to Sort-able Device List. Hopefully this change could give users a stronger hint on what the page will do.
|
| | |
Also added a Select All and a Clear All checkboxes to make selecting and un-selecting all devices more efficient.
|  Image Added Image Added
Figure 6.2.1 - The second tab in the bottom pane is named Device List | 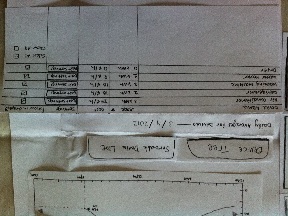 Image Added Image Added
Figure 6.2.2 - The tab is re-named Sort-able Device List. Also added Select All and Clear all checkboxes.
|
Added a warning dialog if user leaves the Device Settings page without clicking the Save Settings button after he or she has made changes – we have seen users forgot to do so. No dialog will show up if user has already clicked the Save Settings button.
| 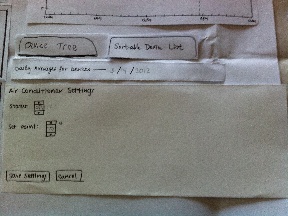 Image Added Image Added
Figure 6.3.1 - The Change Device Settings page. | 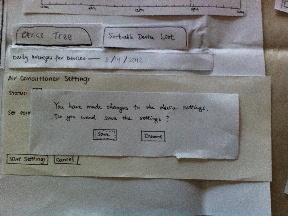 Image Added Image Added
Figure 6.3.2 - A warning dialog is added if he or she makes changes but forgets to click the Save Settings button before navigates to another page. | | | |