Current Statistics
(Dome Statistics and usage data began July, 2010. All previous data was collected from stakeholders and manually.)
Total Items
3/2011- 54,374
2/2011- 52,595
1/2011- 50,999
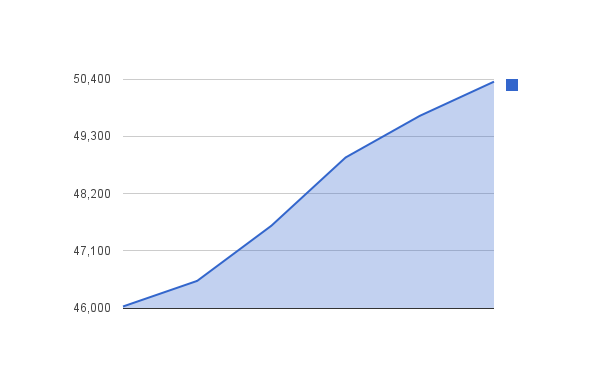
12/2010- 50,342
11/2010- 49,685
10/2010- 48,885
9/2010- 47,574
8/2010- 46,514
7/2010- 46,022
|
----Older Statistics
- Currently items added to DSpace@MIT total 2,580 working papers and reports.
- Items to be added to DSpace@MIT by end of fiscal year total 6,681 working papers and reports.
- Currently items added to DOME include 5,036 items (does not include the Architecture, Urban Planning, and Visual Arts Collection)
- Items to be added to DOME by end of fiscal year total approximately 7,000 items to include images, journals, research notebooks and technical reports
- DOME has 38,316 items
- Contributed 2,209 books to the Internet Archive
- As of January 1, 2010 there were 249,110 total downloads of the items in the Internet Archive
- Ranked 6th out of 23 contributing BLC institutions in contribution to the Internet Archive
- 13,352 images added to Architecture, Urban Planning, and Visual Arts since July '08
- 10,360 images added to Architecture, Urban Planning, and Visual Arts fiscal year '08-'09
- 2,992 images added to Architecture, Urban Planning, and Visual Arts since July '09 to present
New Media, Experiment, Outreach:
- flickr:168,790 views of our images in flickr
- flickr:Vail Balloon prints 29 photos added March 26, 2009 with 843 visitors viewing the collection
- flickr:Kepes Lynch 1,908 photos added June 16, 2008 with 12,177 visitors viewing the collection
- flickr:our flickr sets were mentioned in approximately 10 blogs
As of August 18, 2010:
DSpace@MIT: Items: 42,895, Collections: 498, Size: 870GB
Dome: Items: 46,082, Collections: 10, Size: 1.086GB
Total: Items: 88,977, Collections: 508, Size: 1.9TB
As of December 31, 2010:
Dome Items: 50,349
Ingested 4,320 items into Dome first half of FY'11
Dome growth Sept - Dec 2010

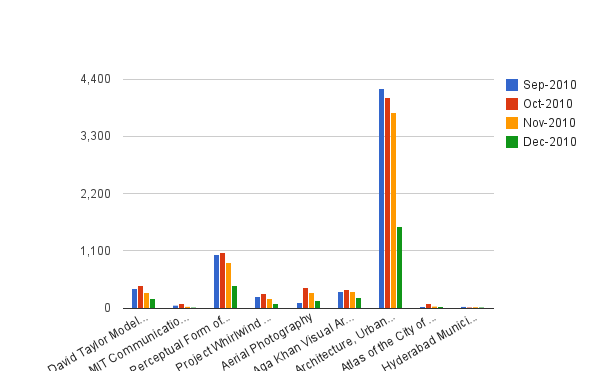
Usage by collection Sept - Dec 2010 
Dome Report Links
September 2010 reports: see attached Excel spreadsheets
October 2010 reports: see attached Excel spreadsheets
November 2010 reports: https://dome.mit.edu/stats/rpts/2010/11/
December 2010 reports: https://dome.mit.edu//stats/rpts/2010/12
As of 3/3/11 (gathered for Visiting Committee):
- Images: 49,233
- Maps: 344
- Documents (pdfs of transcripts of interviews, technical reports, annual reports, forum notes): 3,149
Total items in Dome: 52,726 items
On pace last 12 months of 1,000 items per month of growth.
The first items were ingested in the Fall of 2006 (Sept. 11, 2006 to be exact).


