Platform requirements
- Android phone, running version 2.1 or about (API version 7+)
- Can be run on the Android emulator (installation instructions)
How to install the Android app
- Allow unknown source installs
- Download app
- Run installer
- Run app
1. Allow unknown source installs for Android
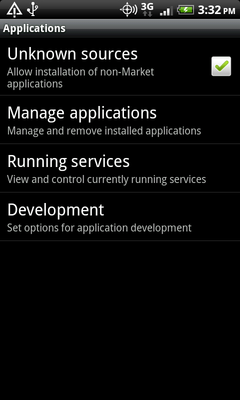
Go to Settings > Applications and check Unknown sources
|
|
|
|
|
|
2. Download prototype
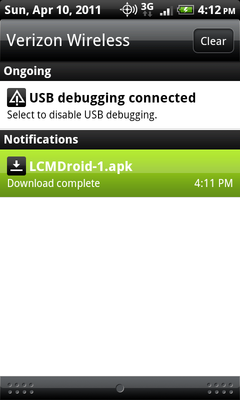
On your phone, navigate to http://abarry.org/mit/LCMDroid.apk to download the application.
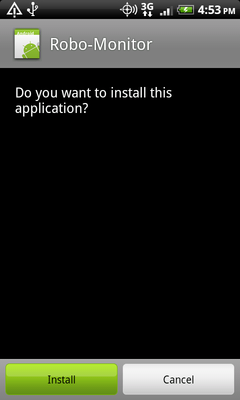
3. Run installer
|
|
|
|
|
|
4. Run app
You can click Open after the installation screen or you'll find the app under Robo-Monitor in All Applications.
Shallow prototype
This is not a ready-to-ship prototype, so some portions are deliberately shallow:
- Data plotting should be parallel for all channels in real time. In our prototype, we show each channel drawing the data each time it is selected.
- All data is canned and only runs a stream only the first few seconds. In real life the data will be arriving as a continuous stream all the time.
- Double-tap on the graph screen is unimplemented.
- No artwork (such as the application icon) is completed.
Scenario Instructions
When testing our application try to imagine yourself in the following situation:
You are programming a small flying quadrocopter to follow navigation commands. It is presented at the figure below as the black bended clipper. It needs to go for few meters in the X direction and then int needs to turn left.
The quadrocopter carries a laser scanner which measures the distance between the quadcopter and the ground and the wall. The quad applies controlls to its motors which make it go or turn.
There is a position sensor on the side which scans the area searching for the quad and then reports its position to the controlling computer. The controlling computer receives the position and publishes waypoints which the quad tries to follow. All that information is passed along between the different components on the local network.
So, when you start the quadrocopter you expect that it will follow the dots in the map. You let it fly and it reaches the turning point very quickly, but it doesn't turn. Disappointed, you stop the quad and look at the data on your robo-monitor (our application).
The moment you start the application all the data is replayed from the start of the experiment.
All of these components are prone to failure: The laser scans can report wrong information, or just don't report any information.
The quad mechanics or electronics can be mis-wired which may lead to applying wrong controls to the motors. The position sensor suffer from
the same types of errors like the laser scanner and the ground computer may be buggy, may have virus, or may just use a wrong algorithm.
Your task is to find what is wrong with the quadcopter and why it did not turn.
This is not a guess-what-I-am-thinking type of task. The data in the application should be clear to show you what is wrong with the system. If you pay a good faith effort to figure it out and cannot then the problem is in the interface and we'll be happy to hear your feedback on why do you think the interface is hard to use.
Other notes
This application uses a number of different libraries, including plotting from arity-calculator, which is licensed under the Apache License, Version 2.0. We have made several improvements to their code and intend to submit our patches upstream.
Patches include:
- Point-based multitouch zoom (instead of zooming to the center in all cases)
- Multitouch drag support
- Infinite-horizon scrolling
- Small bugfixes


