GR6
Design
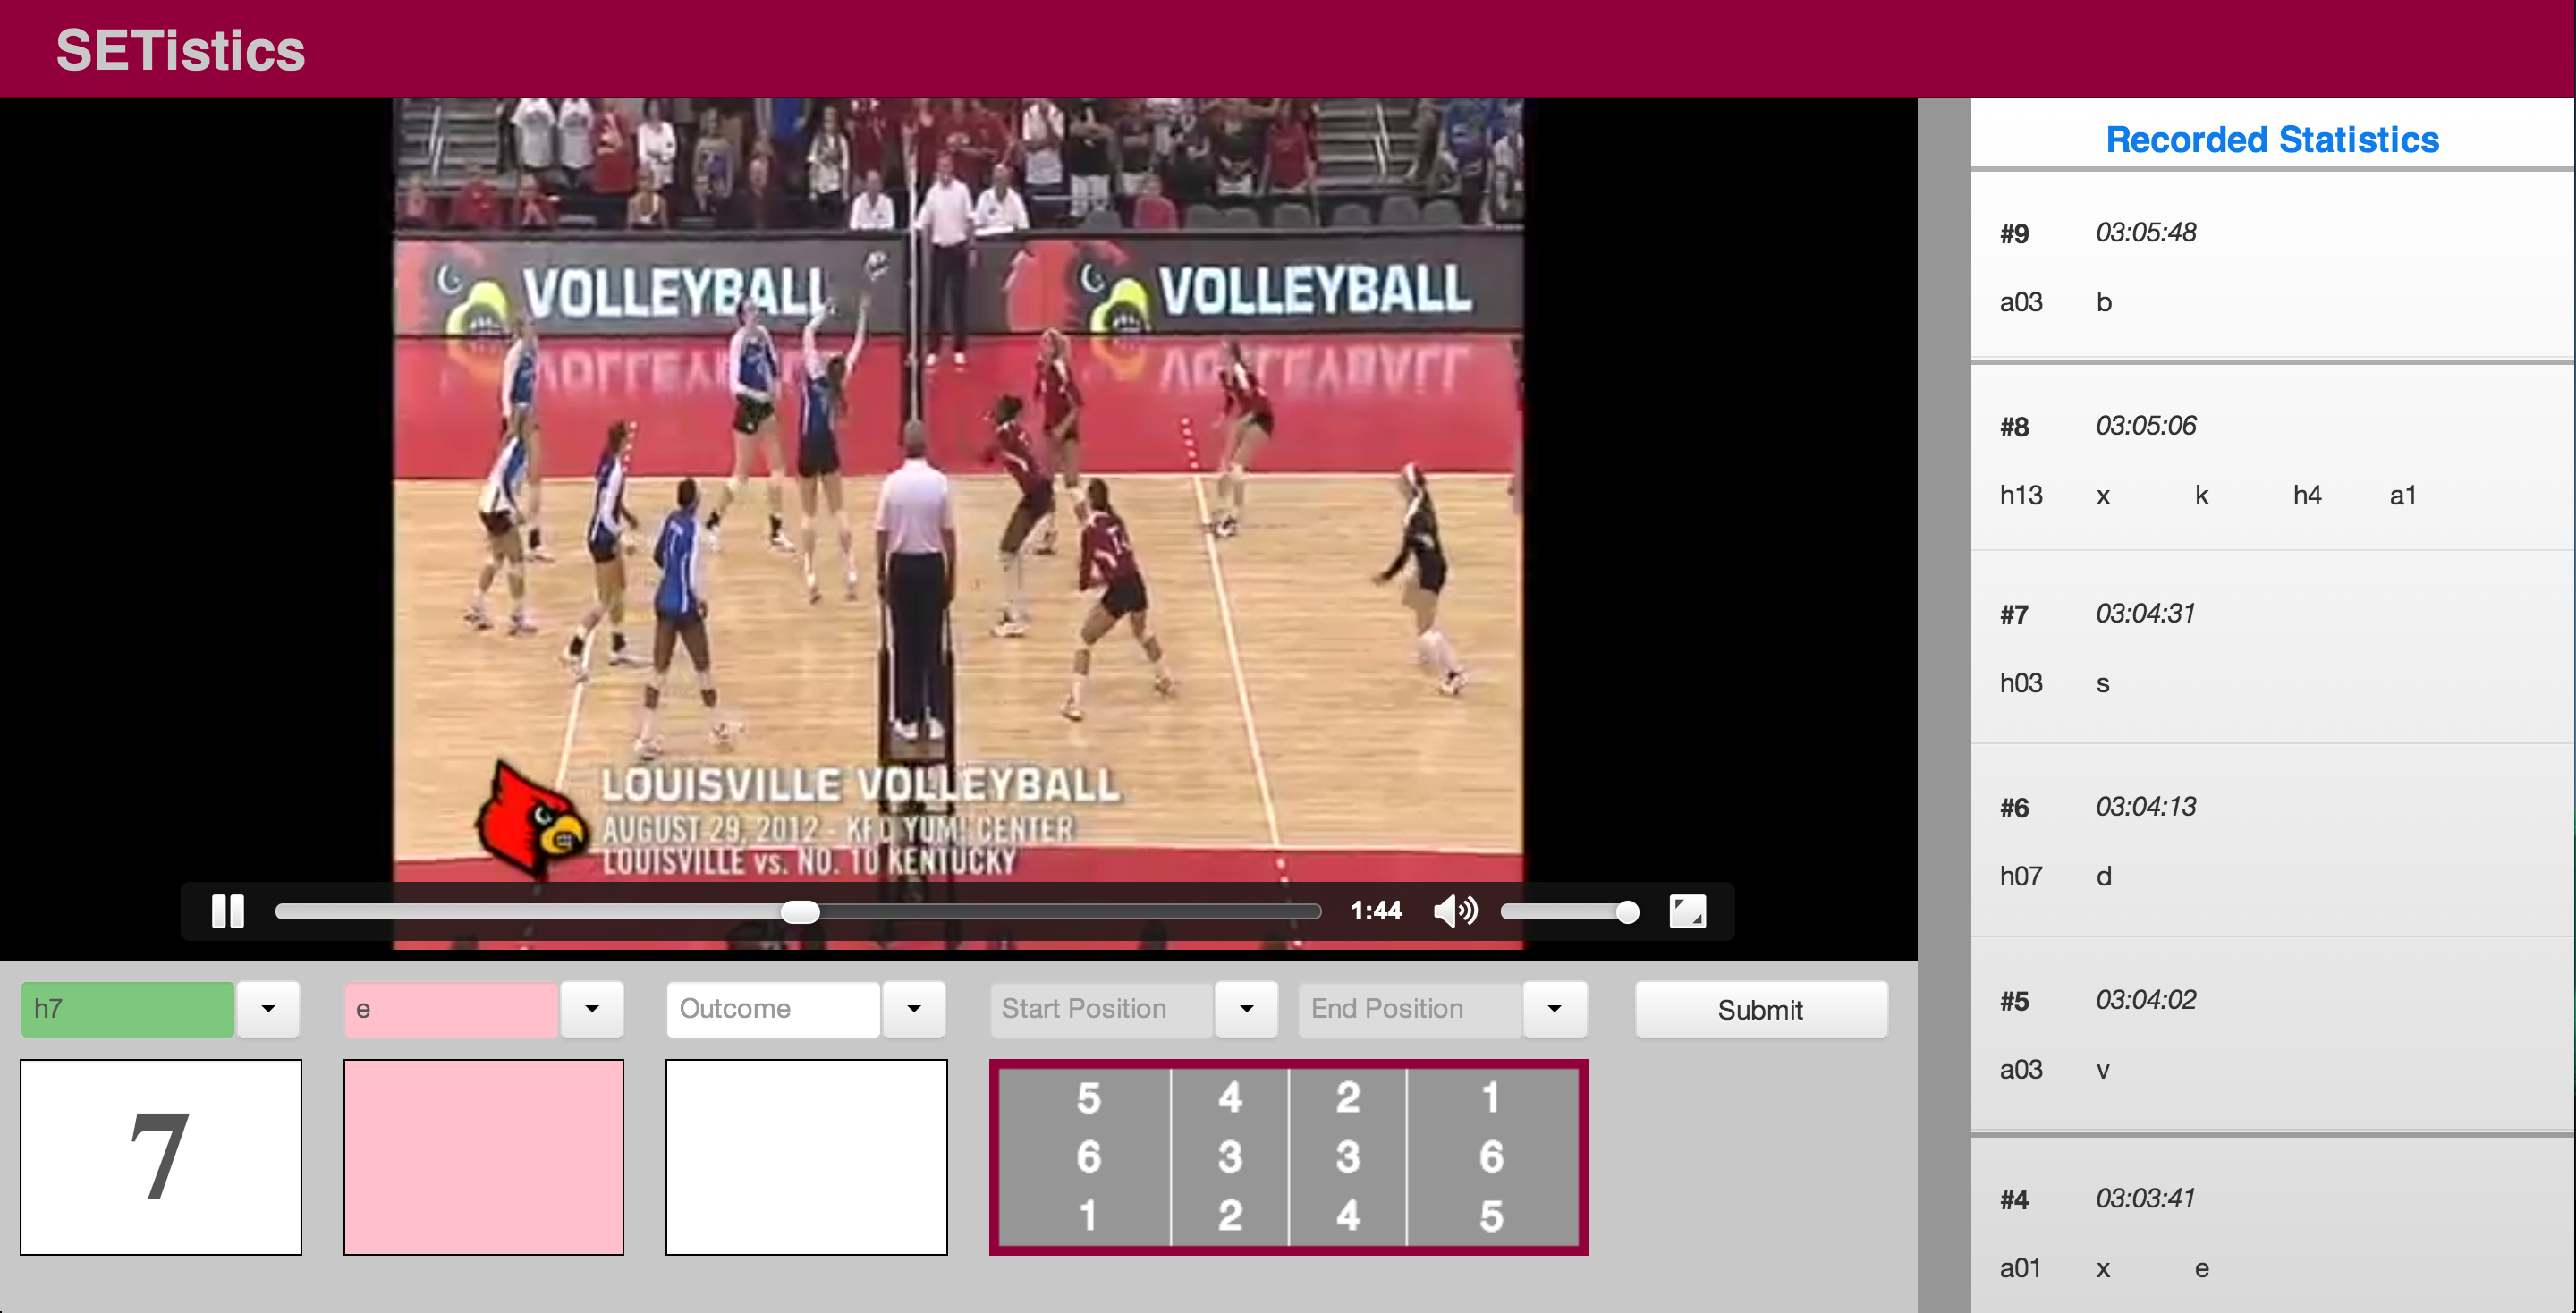
Our final design has 3 main components: the video feed, the input form, and the recorded statistics.
Video Feed:
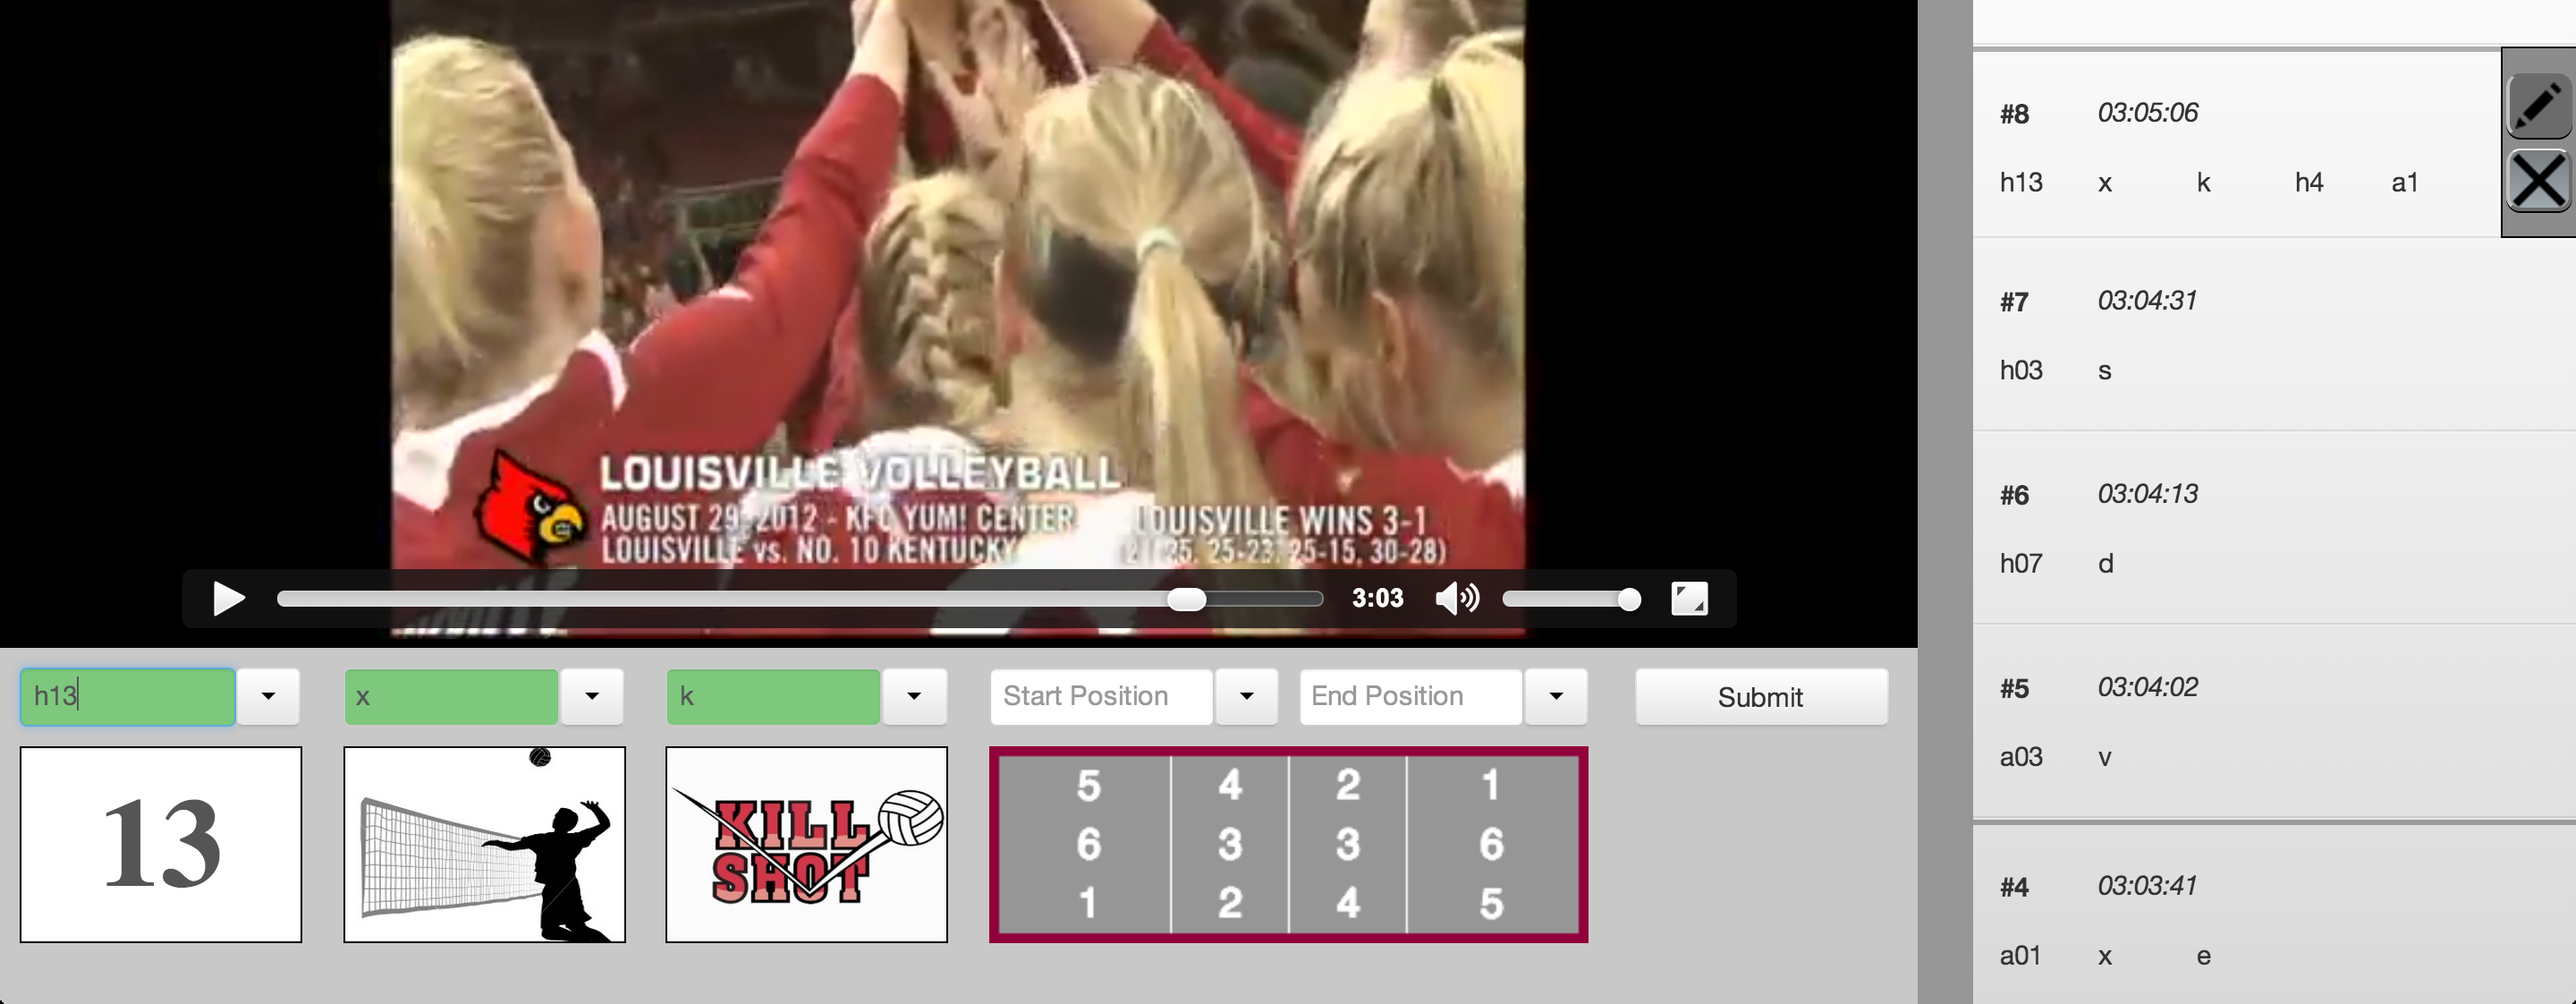
The video feed is the source for the statistics. One user of SETistics can replace a traditional team of two stat-takers by combining the spotter (who calls out what is happening in the match) & the recorder (who writes down the called out stats on paper) into one. The large video size provides comfortable viewing for our users while custom video controls (context-sensitive playing and pausing) increases efficiency.
Input form:
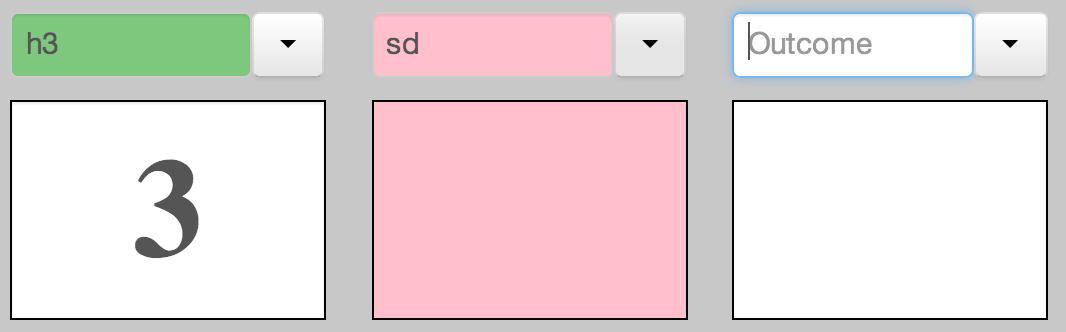
To generate statistics, users interact with the input form. The input form consists of the input fields, feedback icons, and submit button grouped together below the video feed. The linear layout suggests a left-to-right workflow when entering statistics, while the automatic focus switching grants efficiency. Though learnability is not the primary objective for this design, the textfield hint text and drop down menus allow users to use external consistency as a learning tool. Dynamic visual feedback within the icons and colored highlighting prevents slips from becoming recording errors, thus improving safety. 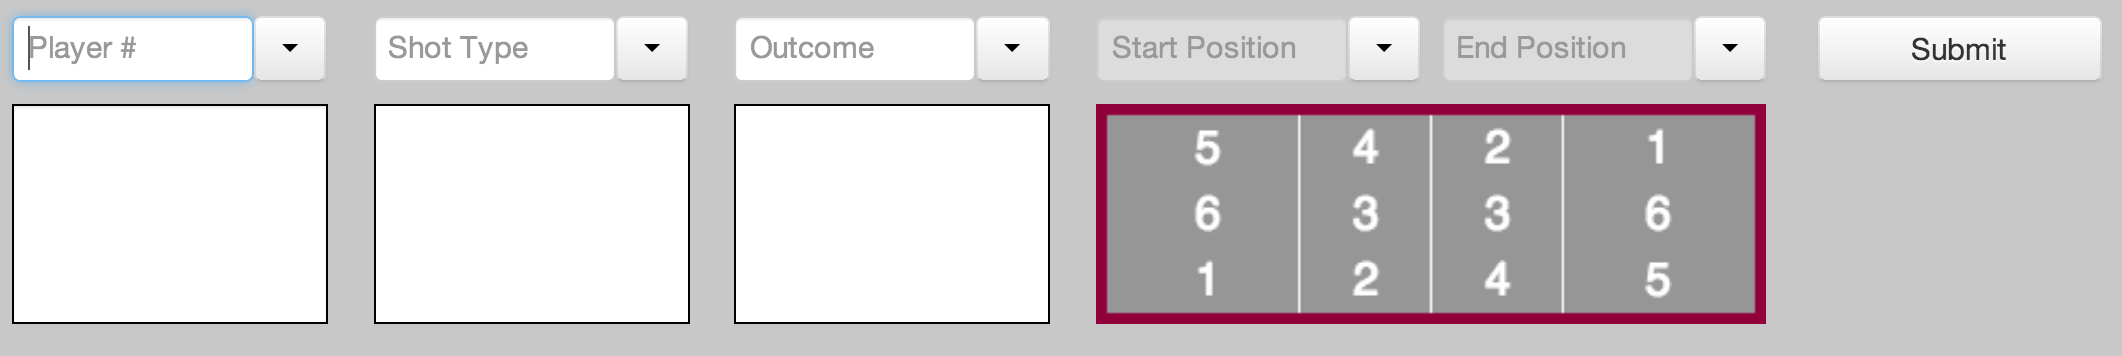
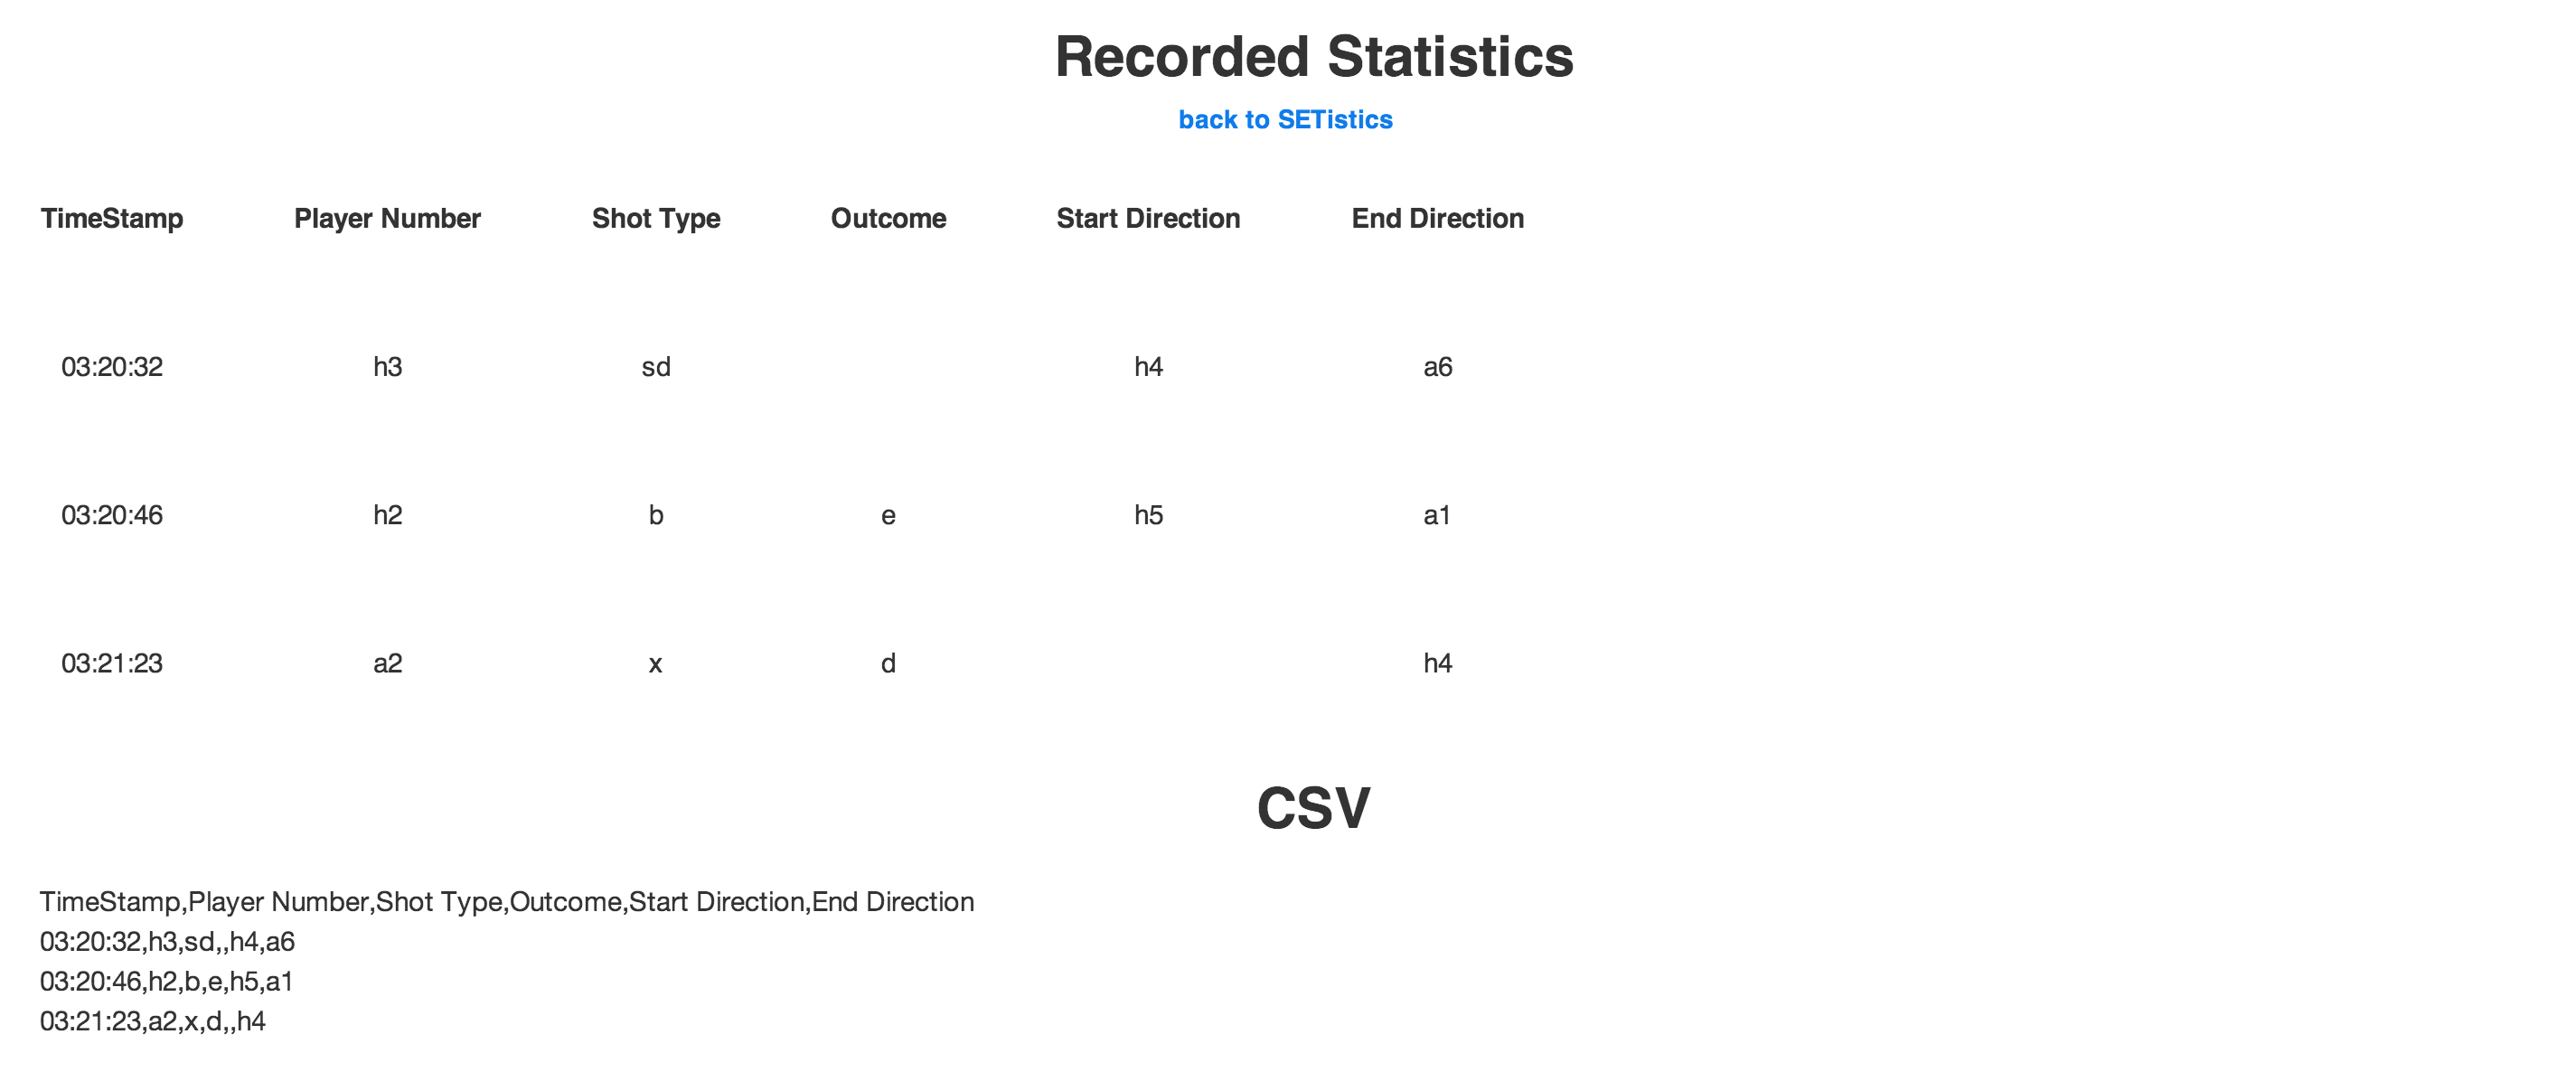
Recorded Statistics:
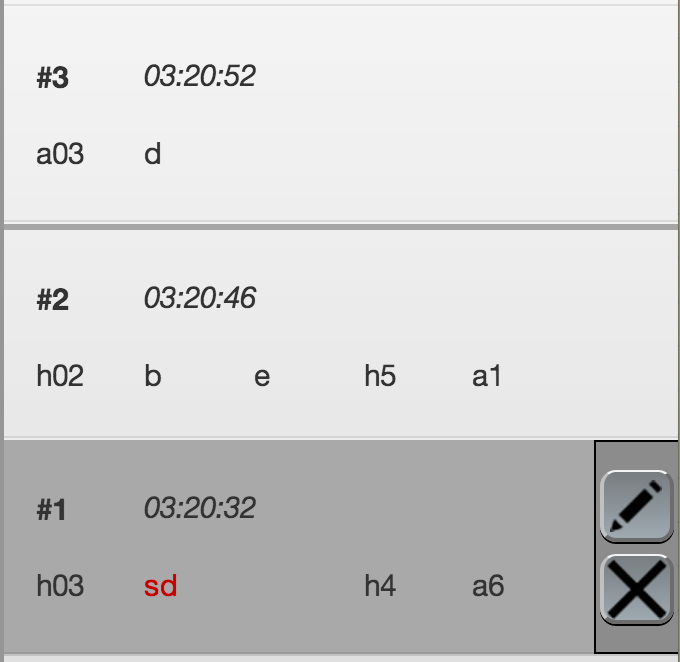
Once statistics are entered, they become visible on the Recorded Statistics section after animating into the top row. Affordances for selecting rows are provided via highlighting and edit/delete buttons that slide out during mouse-over events. Command shortcuts are displayed here in the same manner as they were in the input form to fulfill internal consistency. Statistics are chunked together by separating statistics from different points with a line divider, allowing users to quickly find a statistic for editing. Invalid parts of statistics are shown in red text, again providing internal consistency, with the red highlighting in the input form.
Design Decisions and Alternatives
- Menus display upwards for efficiency and aesthetic -> don't need to scroll down (scrolling down brings up layout issues and takes time)… sacrificed a bit of external consistency, but we believe our "drop-ups" still feel familiar as they have almost exactly the same look & feel as standard drop downs
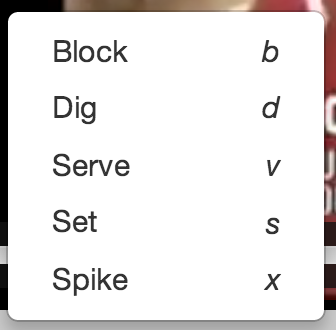
- Single letter commands hurt safety slightly as one letter differences can now register as correct even if the user did not intend to type that. However, it significantly increases efficiency and visual feedback helps prevent such slips from become actual recording mistakes. Safety is also aided by the fact that statistics are easily editable.
- Editing used to be done within the record statistic in the statistic's row. Affordances for editing in recorded statistics were poor and editing itself was inefficient. Switched to editing within input form. Clicking on edit populates input form, allows for quick edits due to pending-delete feature, and pushes changes to record statistics.
- Input form is set up to clearly indicate workflow. Statistics are filled in left to right, with the submit button on the far right of the input field. Statistics pushed into recorded statistics animate into their respective rows further right.
- Video player included to cut two-person job down to one-person (spotter & recorder -> just recorder). Large, dynamically set size allows for great visibility. Automatic pause occurs when a user starts typing a stat, edits a stat, or views the recorder statistics in export format. Automatic play occurs when user submits a stat. These features increase efficiency (no need for user to manually play pause) while allowing more statistics to be taken at a higher quality. Video can be seeked manually to skip downtime to allow users to catch up from statistics-heavy points.
Paper prototyping
- Chose command line interface over touch interface for optimal efficiency.
- Information scent improved with Input hint text: player, shot type, outcome, start position, end position. Reflects the drop downs accurately.
- Ball movement feedback displayed on small court along side other feedback icons.
- The video used to run continuously. It now pauses while the user is entering a shot and continues when the user is done. This allows the user to not miss any action and catch up between points.
Heuristic evaluation
- Providing feedback for valid & erroneous input: Dynamic green and red highlighting respectively within input form as user types. Black & Red text in Recorded Statistics once statistic is entered.
- Space and tab advance keyboard focus along the input field. Hitting enter submits statistic. Shift-tab pushes focus back
- Responsive layout: window resizing handled with Bootstrap. Min/max widths heights set to avoid unsightly formats.
- Standardized naming (previous commands -> recorded statistics) for increased internal and external consistency
- Eliminated visual noise: “1” instead of “Statistic 1” , chunking by grouping with whitespace, reduced contrast in court image
- Editing moved out of recorded statistics and into the input form
- Rows of recorded statistics have selecting affordances through individual highlighting during mouse-over. Sliding edit/delete buttons added.
- Hotkeys added for switching between input fields (F1, F2, F3, F4, F5) to increase efficiency.
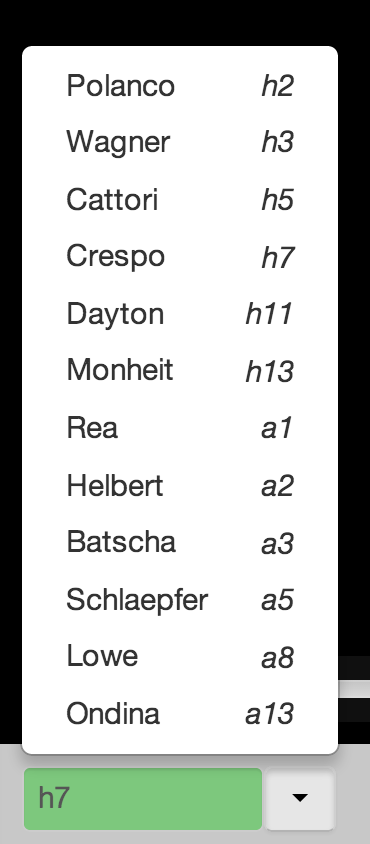
- Drop down menus implemented to have external consistency: display all options with shortcuts displayed along side in italics.
- Statistics are timestamped to maintain chronological ordering even when exported.
- Confirmed terminology with volleyball players for learnability and external consistency purposes.
- Included pending delete to further improve efficiency when editing
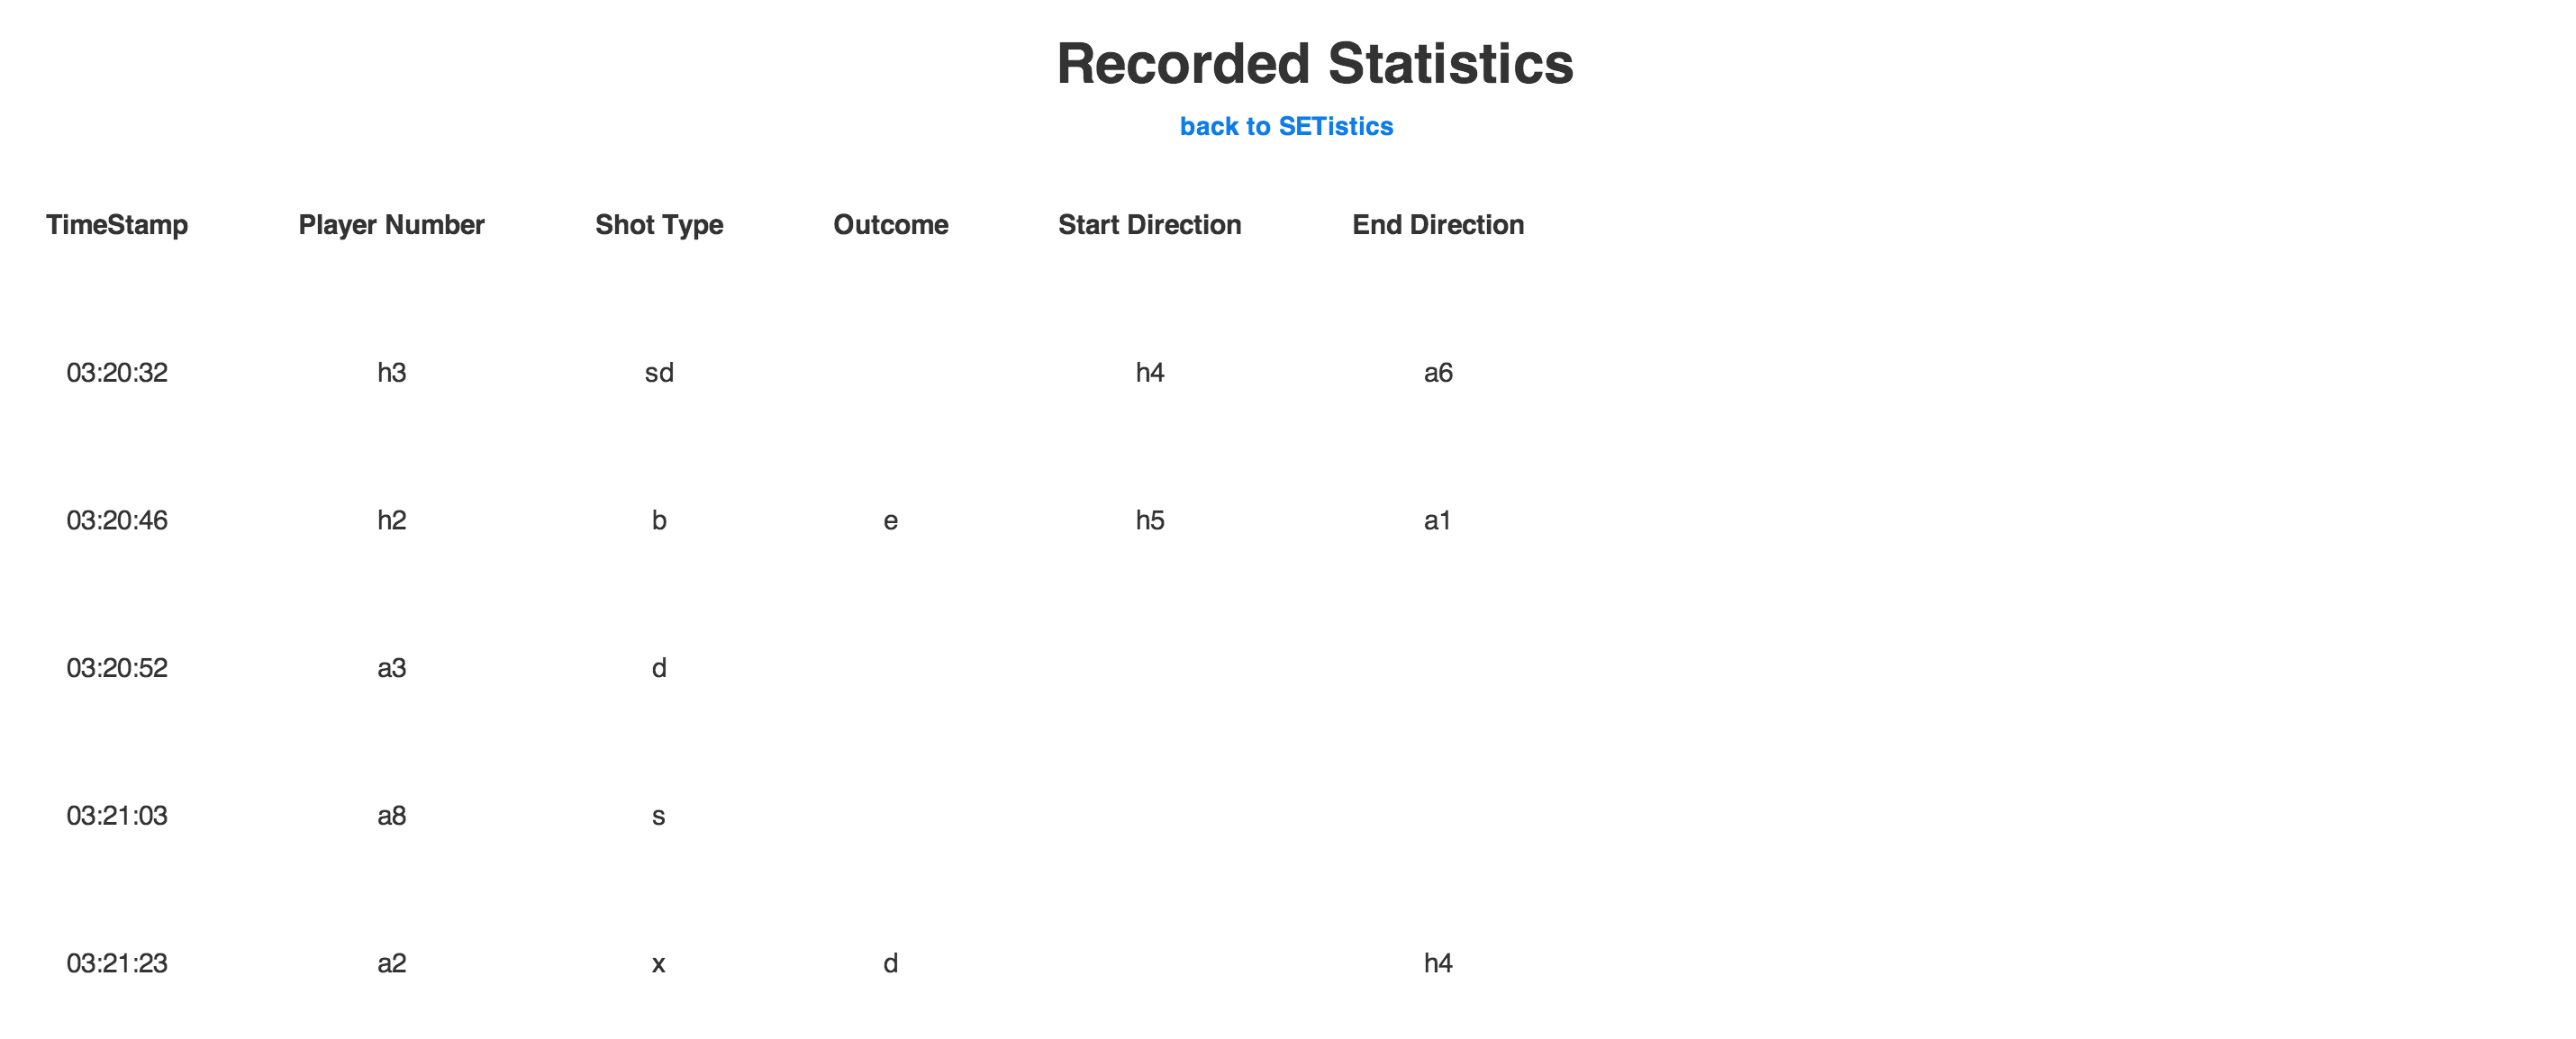
- Export statistics in human-readbale printer-friendly formatting
- Buttons for switching between SETistics and recorded statistics views are given affordances of links (blue text with change in color on mouse hover)
User testing
- Greyed out input fields for start/end positions until player and shot type were entered. Positions are only relevant for certain shot types. Stats are irrelevant without knowing which player did the action.
- Switch order of input fields to reflect optional nature of start/end positions. Outcome is used more often than positions so it comes first. This way stat takers won't have to tab through start/end positions to enter an outcome.
- Export supports CSV formatting (for use in other applications, such as Excel, for additional organization and/or analysis)
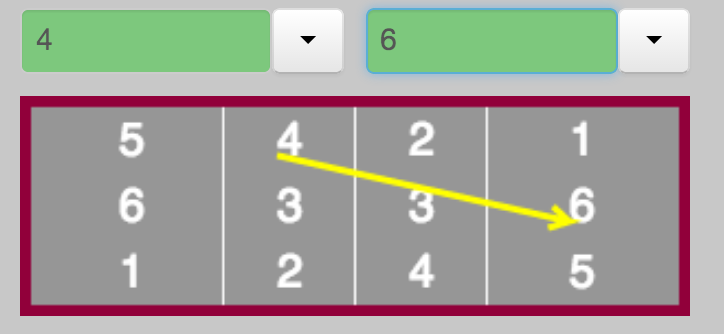
- Single letter commands for efficiency. Start/end positions now dynamically set by knowing if player is home or away player, allowing single letter commands for start/end position.
- Improved start/end position visual feedback by increasing contrast of the drawn arrow. Arrow is now thicker and bright yellow.
- Chunked statistics by point. Thick, darker lines separate statistics from different points. Different points are identified when a kill or error is recorded.
- Homogenous recorded stats. All statistics in recorded statistics are displayed in the same manner: only shortcut commands are displayed.
- Manual play/pause button (F8 since there is nice mapping on mac computers: F8 has a play/pause icon on it) to increase user control.
Implementation
Implementation design decisions:
- Bootstrap was used extensively to create a responsive layout as well as to generate our drop down menus.
- HTML5 video was chosen as our video player for its simple API allowing for video playing/pausing. We tried embedded youtube videos, but the API required a web server. Vimeo was considered, but did not have quality volleyball videos. jPlayer API was complicated and the player is unfamiliar to most users.
- We defined focus switching on tabbing/space for each textfield as well as the submit button to avoid selecting drop down buttons or other elements.
- A canvas was used for feedback in the court diagram and arrow drawing showing start/end positions. Canvas provides flexibility to draw arrows in any orientation.
- Pairs of textfields and button drop downs are grouped to provided the illusion of a drop down enabled textfield.
Implementation affecting usability:
- Hidden div for exporting becomes visible when recorded statistics link is clicked. using a hidden div allows us to share objects between views without a backend, though without a back end statistics do no persist between refreshes. Fixing this would require setting up a server to store statistics.
Evaluation
We consulted the MIT men's volleyball roster to find most of our users. We also searched for users in IM volleyball and found a captain of a IM volleyball team that volunteered. Most users have taken statistics for their respective volleyball teams, making them perfect representatives.
In addition to the briefing given to GR3, we gave users a brief guided tour.
GR3 briefing:
- “Thank you for volunteering to test our prototype for recording volleyball statistics. The MIT men's varsity volleyball team is playing against Harvard. Our assistant coaches are on the sidelines recording everything that happens in the game. SETistics is an application designed for the recording and analysis of information captured during volleyball matches. You are tasked with recording the various statistics that arise during MIT’s match. You will be presented with a series of tasks that you will use the SETistics prototype to complete. We would appreciate any and all feedback that you can provide during and after the tasks, so we encourage you to talk as you complete each action. Thank you again for your participation! Do you have any questions before we get started?”
Brief guided tour:
- Showed users the available commands & gave examples of efficient use of the input form.
- Our design is focused on efficiency, not learnability, so a guided tour did not defeat the purpose of our user tests.
Usability problems & how to fix them:
- Some usability issues were fixed between user tests. These fixes are described in the design section under "User Testing"
- Initial heavy use of mouse to select inputs as well as attempted use of spacebar to pause/play video. More experience with SETistics necessary: "If I had more time with this, I would be able to use it much faster". Other fixes may be to remove affordances for traditional video control in some way. Initial mouse dependency declined after a few uses.
Reflection
Do differently:
- Communicate with actual users more frequently and further in advance to nail down terminology and consistency with already in-place statistics taking techniques
- Employ KLM testing for measuring efficiency more quantitatively. With this, we could make benchmarks and test whether efficiency markedly increased between design cycles.
- Increase number of iterative design cycles in computer prototyping. A large number of features were implemented and added to the design in each of the few computer prototypes we made. With more prototypes, we would be able to better modularize which components are being tested.
Prototyping techniques:
- We found the wizard-of-oz backend to be an important tool for testing usability without having to devote effort into implementing any backend. Though we saw it limitations (in terms of computational speed.... we are not as fast as computers), it greatly aided in our early design efforts
- Learning about high breadth, low depth computer prototypes allowed us to test the look & feel of our design before committing time to fully implementing it.
1 Comment
Unknown User (jks@mit.edu)
Overall: SETistics - you picked one of the most unique problems in the class and I think you made great decisions to gear the system for efficiency. As always, would have been good to see someone using this after a good amount of training, to really *know* how efficient it is. Good job overall.