Hi I'm an MIT student and here are some results from my general circulation experiment.
This is under construction. I'm adding nice, friendly arrows to images
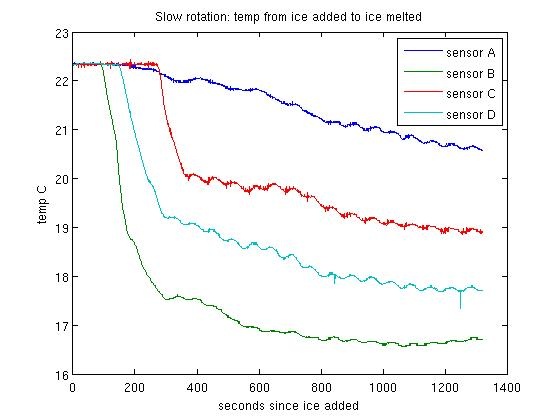
The following graph shows the temperature at each sensor from the time the ice was added to the time the ice had completely melted.
The following graph shows the temperature at each of our four sensors from the time ice was added to the time the ice had completely melted.