There were two things I wanted to highlight from the lab I did on Convection. First I wanted to comment on the success in setting up a linear temperature stratification and then talk about super-adiabatic behavior near the heat source in both the tank experiment and in the atmosphere.
I will refrain from describing the set up for this experiment because it is the same linear stratification experiment described on the Weather in a Tank website. Seven temperature probes were placed at intervals of 1 and 1/4 inches and labeled position 1 through 7, where position 1 was the closest to the bottom of the tank and 7 the furthest away.
Achieving a linear temperature stratification was a little complicated. First the coldest layer of water was added to the tank, which was about 19 C, and then a barge made of sponges held together by a metal frame was placed on the surface of the water. When the next layer of water was added, it was poured onto the barge that slowly released the water into the tank, reducing the amount of mixing between layers. Each layer of water was of roughly equal volume and about 3 C warmer than the previous layer.This process was continued until all of the temperature probes were submerged.
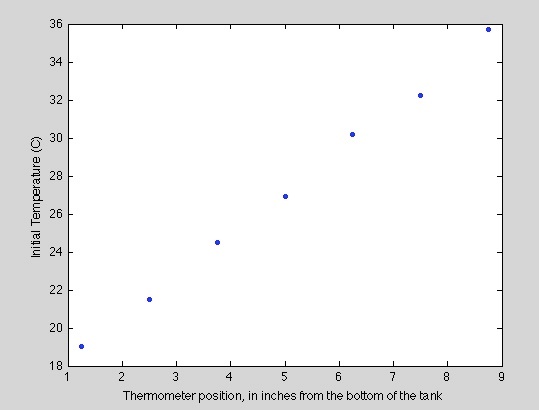
I have to admit, I was skeptical that this was going to work well at all. But when I plotted the average temperature recorded by each thermometer between the time the water was added and the convecting layer reached it against its height (shown in the figure) I was amazed. The initial stratification of the water was remarkably linear. So while the method used to produce a linear stratification may seem crude, it was actually very effective.
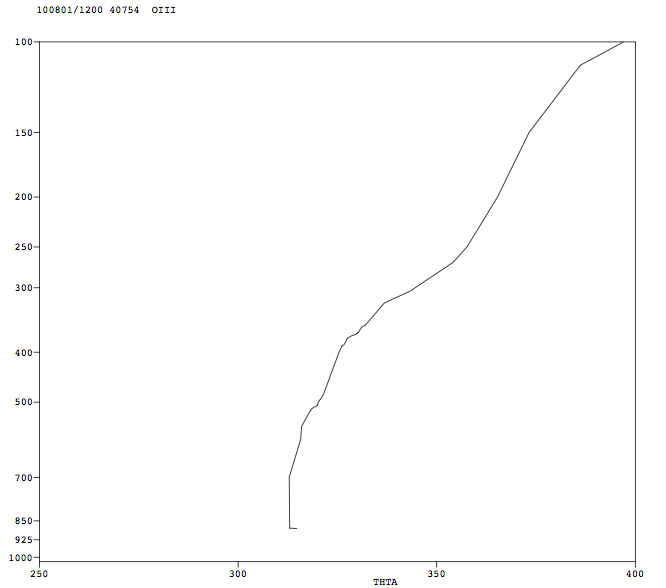
Now I want to talk about super-adiabatic behavior near the heat source. The next figure is from a radiosonde data set taken at a station in Iran in August of 2010. It it of potential temperature verses pressure. What I want you to notice is the little tail right near the surface that is warmer than it should be from convection. If it were being warmed by convection alone, that region would fall on the line of constant temperature indicative of convection that the air just above it follows.
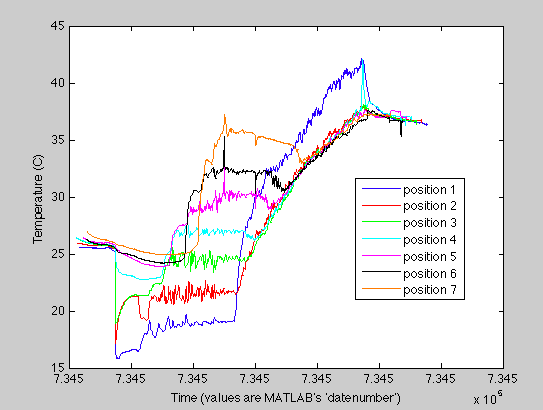
This phenomena of super-adiabatic behavior near the heat source was also observed in our tank experiment. Below is an image of the temperature data taken during the linear stratification tank experiment. The position labels correspond to how the thermometers were arranged for the experiment, with 1 the closest to the heating pad. Notice that all of the data recorded fits the pattern we would expect, roughly constant temperature until the convecting layer reaches it and than it increases like the square root of time, except for the temperature recorded at position 1. This data is consistently warmer than the nice curve the data from the other probes fits on. This is because of the super-adiabatic behavior near the heat source, similar to the air just above the earth's surface in the radiosonde data. The super-adiabatic behavior may be more exaggerated than would normally be expected for being 1 and 1/4 inches above the heat source. However, the thermometer was located near a corner of the tank and the corners of the heating pad had a tendency to not lie flat. The actual distance between the thermometer and the heat source could have actually been much less than 1 and 1/4 inches, which explains the degree to which the super-adiabatic behavior was observed.
These were two of the interesting results I got from doing the Convection lab. I hope you found them as surprising as I did!