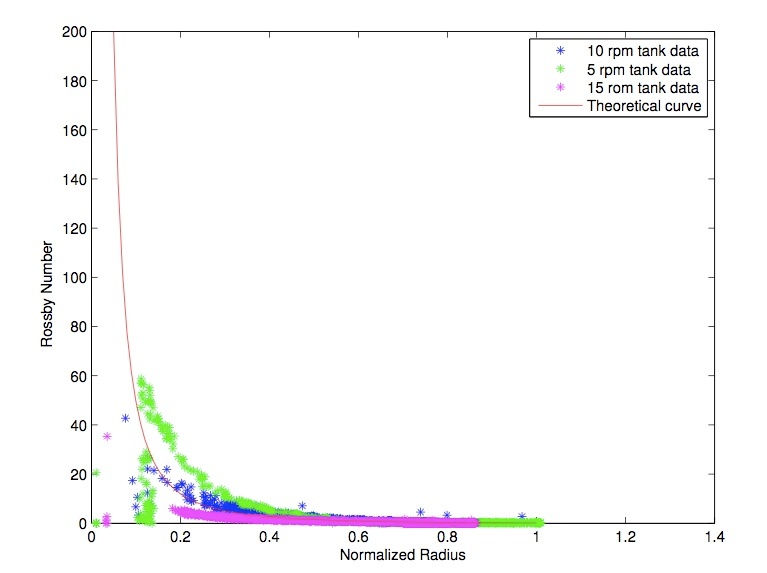
The balanced vortex experiment was performed at three different tank rotation speeds, with the results here plotted against the theoretical Rossby number for each radius:
Several interesting trends were noticed in the plots of angular momentum vs. time as seen here: 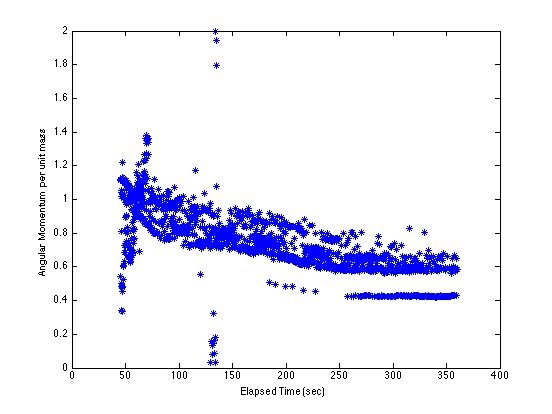
Angular momentum per unit mass (units of meters^2 per second) for all particles in the 5 rpm tank with respect to time (in seconds). Theoretically this plot should show a constant line as angular momentum is conserved, but general downward trend can be seen as the particles lose energy to friction.
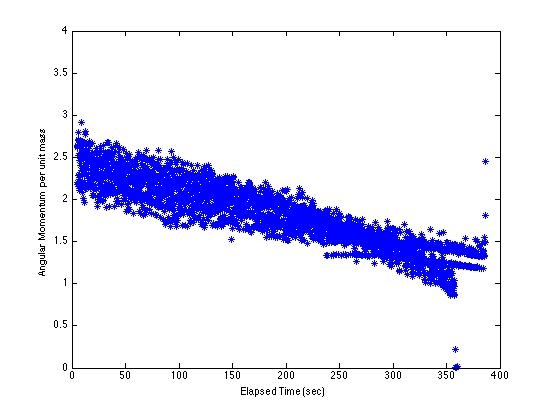
Angular momentum per unit mass (units of meters^2 per second) for all particles in the 15 rpm tank with respect to time. This plot shows a clear downward trend as energy is lost to friction. Compared with the plot for the 5 rpm tank, this plot has a steeper slope, because there is more friction in the faster moving water.
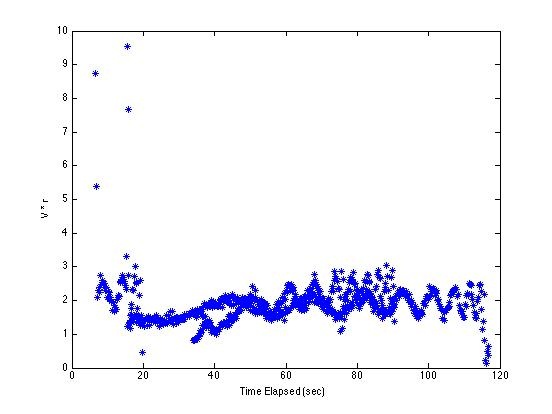
Angular momentum per unit mass (units of meters^2 per second) for all particles in the 10 rpm tank with respect to time. This plot shows angular momentum to be fairly constant, with the periodic motion at the end most likely due to a particle circling very close to the vortex. This plot is over a much smaller time scale than the other two cases, so there has been less time for the effects of friction to become apparent.