By Amanda Vanegas Ledesma
What are Hypoxic Zones?
Hypoxic zones, also known as "dead zones," are areas of the ocean, at around 100m depth, that have oxygen concentrations below 2ml of oxygen per liter. This is, they are basically depleted from oxygen. These zones can occur naturally or be created or enhanced by human activity.
How are hypoxic zones created?
An excess in the nutrients influx to the ocean, for example, from fertilizers, leads to a process called eutrophication. This is an increasing in the rate of primary production and organic carbon accumulation, in excess of what an ecosystem is normally adapted to processing. The ecosystem responds to this nutrient enrichment by inducing an excessive growth of algae and vegetation in coastal areas. This excess causes an increased flux of organic matter to the sea bed. When this organic matter decomposes it consumes oxygen, creating a dead zone.
Organisms living in the ocean are very sensitive to changes in oxygen concentration, and thus can be greatly impacted by small changes of it. Oxygen is not very soluble in water: for freshwater at 20C only 9.1 mg of Oxygen dissolve in 1 liter. Therefore, a change of 1mg of oxygen per liter implies a 10% difference on the overall ocean oxygen concentration. Moreover, oxygen solubility is very sensitive to changes in temperature and salinity, and thus it can be easily impacted by climate change (Benson and Krause 1984). The effects of hypoxia on marine life became critical around the 80’s when large areas of low dissolved oxygen started to appear with associated mass mortality of fishes.
Hypoxic zones can occur naturally, for example, coastal upwelling zones along the western side of the continents are highly productive, thus respiration of fluxes of organic matter can produce severe hypoxia. There are several persistent oxygen minimum zones created by natural conditions, such as the one in the Pacific Ocean. The most important difference between natural and human induced hypoxia, is that in natural hypoxic zones the marine life has adapted to the low oxygen conditions. However, as it is illustrated in Figure 1, in human created or enhanced dead zones most of the marine life of cannot survive.
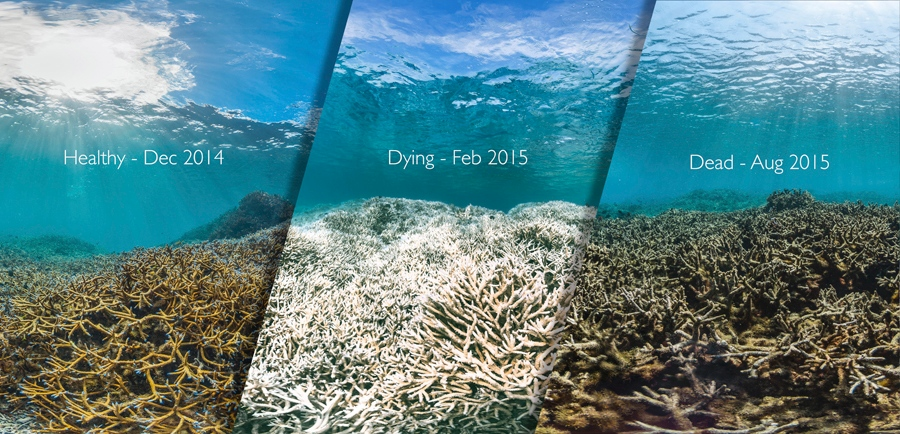
Figure 1: American Samoa hypoxic region (https://app.emaze.com/). It is evident how the low levels of oxygen
destroy marine life that did not evolve to adapt to the hypoxic conditions.
The Gulf of Mexico Hypoxic Zone
Every summer in the Gulf of Mexico a hypoxic zone appears as a consequence of the massive amounts of nitrogen and phosphorous coming from the Mississippi River (Figure 2). This zone has an average size of 15,000 km2 and has been measured from 1985 to the present. It is the second world's largest hypoxic zone.
This zone presents a strong seasonal dependence. It forms every late spring, when the Gulf receives a massive amount of nitrate flux, and factors such as rainfall, warmer temperatures, and sunlight favor algal growth. Moreover, the waters in this season are calmer, which prevents vertical mixing of the ocean. This lack of vertical mixing means that colder, oxygen depleted waters cannot interact with the fresher, warmer waters of the surface, thus maintaining the hypoxic zone. The hypoxic zone breaks early September when hurricanes and tropical storms mix the ocean.
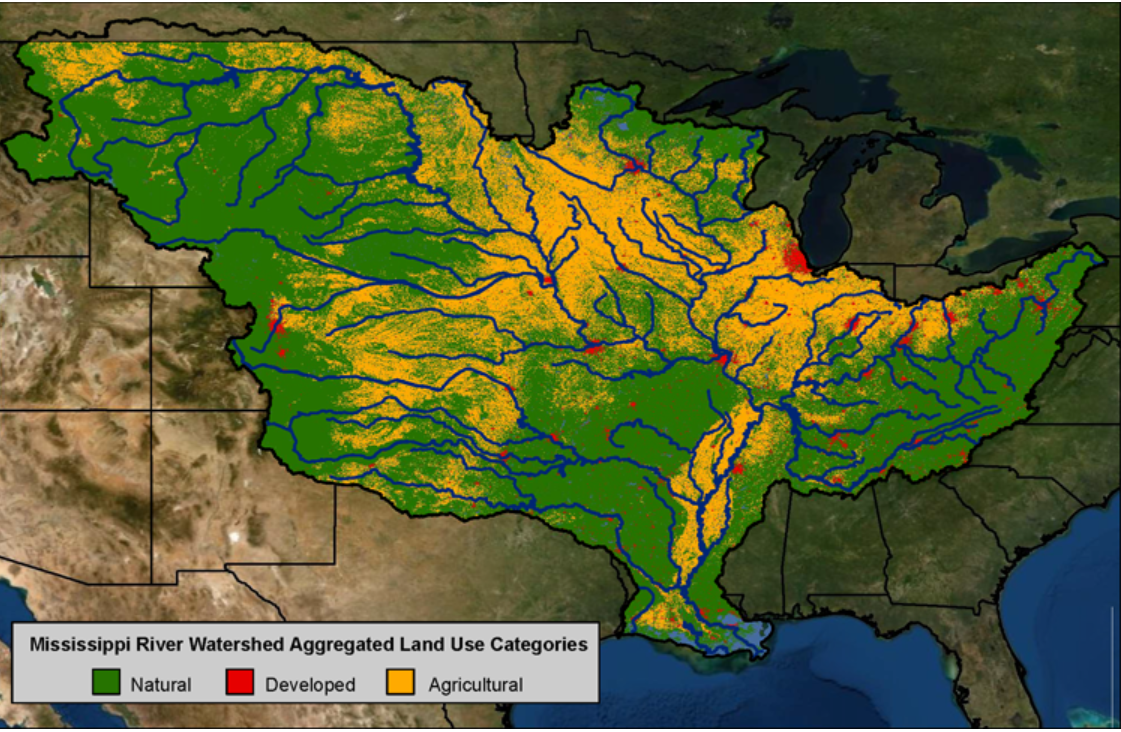
Figure 2: The three major aggregated land use categories across the Mississippi River Watershed: agriculture
(yellow), developed (red), and natural (green). Nitrogen and phosphorus pollution in runoff and discharges from
agricultural and urban areas are the major contributors to the annual summer hypoxic zone in the Gulf of Mexico.
Image from NOAA Press Release.
How can are the nitrate flux and the size of the hypoxic zone related?
In Figure 3, the observed spring nitrate flux from 1985 to 2017 is plotted. The 2019 and 2020 measurements are not included in the plot, but their values are within the 10 largest nitrate flux ever observed. This indicates that the excessive load of fertilizers to the ocean is a persistent problem.
In the figure, the 3 years with highest nutrient load are signalized with red arrows: 1993, 2008, and 2013. The 3 years with lowest nutrient loads are signalized with blue arrows: 2000, 2005, and 2012. In Figure 4, the same years are marked with red and blue arrows respectively. It can be observed that although 1993, 2008, and 2013 did present large hypoxic zone areas, they do not represent the 3 largest hypoxic zones ever measured. The same is true for the years with low nutrient loads: they correspond with smaller than average hypoxic zone sizes, but they are not the smallest zones observed. These observations indicate that besides the nitrate load there are other process involved on defining the extent of the hypoxic area.
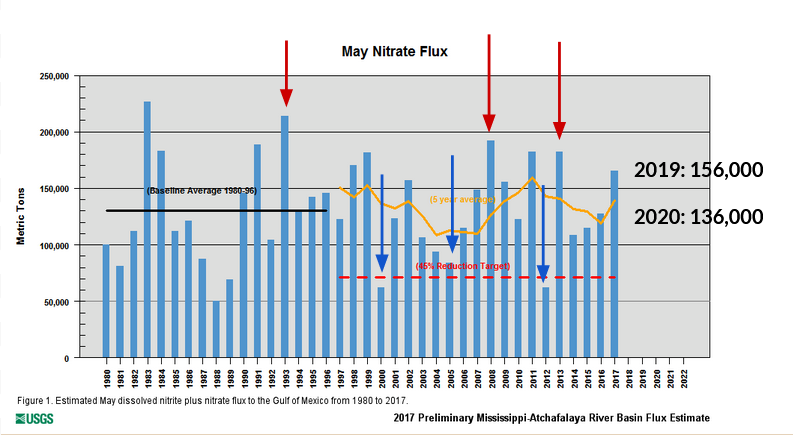
Figure 3: May Nitrate Flux from the Mississippi River in Metric Tones.
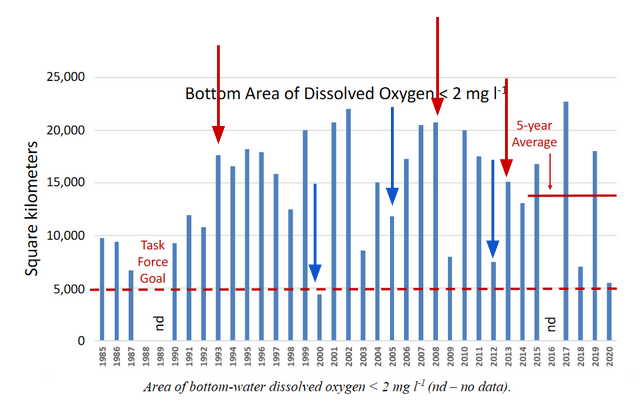
Figure 4: Observed hypoxic zone size in kilometers squared.
Hurricanes and tropical storms mix the ocean, bringing cold water to the surface and oxygen to the hypoxic zone
Every year, a research cruise measures the size of the hypoxic zone. Sometimes, hurricanes and tropical storms break the hypoxic zone, reducing its size, before the annual cruise passes. Hurricanes and storms mix the ocean by two main processes:
Vertical Mixing:
This process occurs because hurricanes' surface winds generate currents in the oceanic mixed layer, by exerting stress on the ocean surface due to friction. Vertical shear of the currents in the upper ocean creates turbulence, which brings cold water from the thermocline up to the surface. This mixing process also brings oxygenated water from the surface to the deep ocean, increasing the levels of oxygen in the bottom-water and breaking the hypoxic zone.
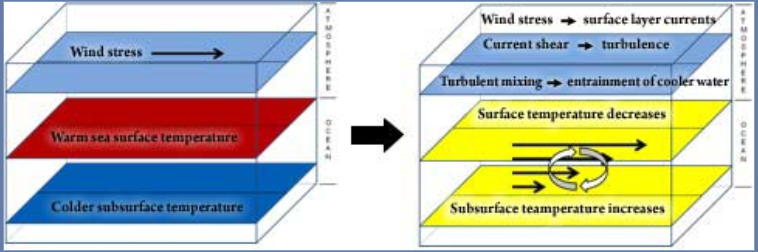
Figure 3: Vertical mixing in the upper ocean.
On the left, a representation of the stratification of the ocean. The top layer (light blue) is the lower
atmosphere; middle (red) is the warm sea surface layer; bottom (darker blue)is the cooler subsurface ocean layer.
On the right, the result of wind stress applied to the sea surface is sketched.
Wind stress generates ocean surface layer currents; vertical shear in the surface layer currents generates
turbulence; turbulent mixing brings colder water from the thermocline up into oceanic mixed layer.
Image from http://www.hurricanescience.org/science/science/hurricaneandocean/.
Upwelling:
Hurricanes create cyclonic winds, which generate local divergence of the water at the ocean surface. Then, water from the deeper ocean rises to fill the void, cooling the ocean surface. Like vertical mixing, this process contributes to breaking the hypoxic zone by mixing the water column.
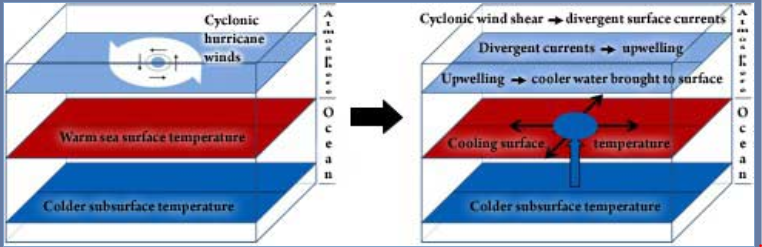
Figure 4: Schematic of upwelling in the upper ocean. On the left, the cyclonic winds generated by the hurricanes
on top of the warm ocean surface. On the right, the area of local divergence on the ocean surface is sketched.
It can be observed that this divergence would create a hole in the ocean surface, which is represented by the
blue circle on the red layer. Subsequently, water from the colder deeper layer will move to the surface to
fill this void.
Image from http://www.hurricanescience.org/science/science/hurricaneandocean/.
How the vertical mixing by hurricanes can be tracked?
Hurricanes leave behind a signature of cold surface temperatures as a result of the vertical mixing. Thus, the negative sea surface temperature (SST) anomalies, displayed in Figure 5, reveal the path of the hurricanes.

Figure 5: Cold wake signatures from 2018 Atlantic Hurricanes (NASA).
The impact of hurricanes' vertical mixing on the size of the hypoxic zone was particularly evident on 2020
As a consequence of large nutrients loads from the Mississippi River on spring 2020, the hypoxic zone was forecasted to be larger than average. Scientists predicted a dead zone spamming around 20,000km2, which is about the size of the state of New Jersey. However, hurricane Hanna passed just before the cruise, mixing the ocean and breaking the hypoxic zone. Thus, the observed hypoxic zone was only 5,048km2, the third smallest ever measured in 34 years of surveys.

Figure 5: Map of measured Gulf hypoxia zone, July-August 2020.
This year the hypoxic zone was the 3rd smallest ever measured in 34 years of surveys(LUMCON/NOAA).
The sea surface temperature (SST) anomalies can be used as a proxy of the vertical mixing caused by hurricane Hanna. In Figure 6, the 3-day average of the SST anomalies before and after hurricane Hanna passed are plotted. It is clear how after the hurricane the surface water was much colder, which indicates that there was a significant vertical mixing that contributed to breaking the hypoxic zone.
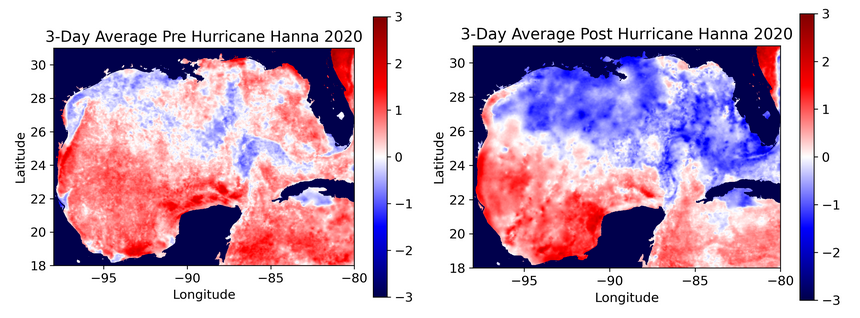
Figure 6: 3-day average of the sea surface temperature (SST) anomalies before and after hurricane Hanna passed
by the Gulf of Mexico. It can be observed how the water got significantly colder after the hurricane.
Cases of hypoxic zones affected by hurricanes
The impact of vertical mixing by hurricanes on the size of the hypoxic zone, and its correlation of this with SST anomalies, was studied by looking at three specific years: 2008, 2019, and 2020 (Figure 7). During these three years, hurricanes Dolly, Barry, and Hanna passed just before the hypoxic zone was measured. Therefore, the hypoxic zone size during these years was possibly affected by the vertical mixing caused by the storms.
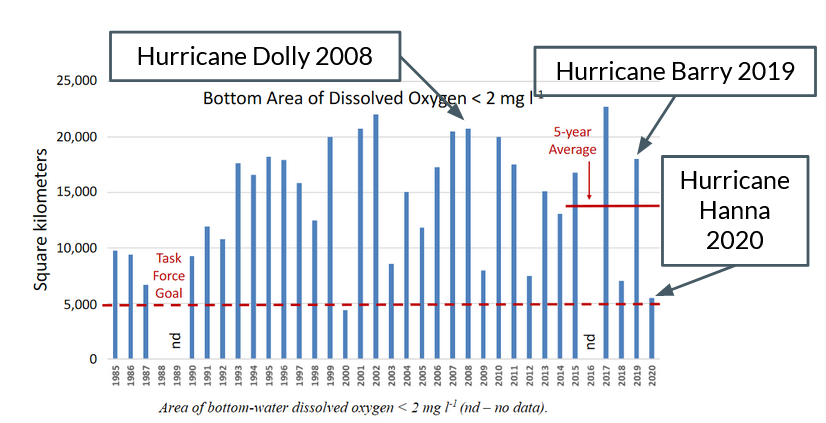
Figure 7: The studied years are marked with arrows: 2008, 2019, and 2020. When hurricanes Dolly, Barry, and
Hanna, respectively, passed just before the the hypoxic zone was measured.
The SST anomalies before and after the hurricanes passed were taken as a proxy of how much vertical mixing occurred. The idea behind how to correlate SST anomalies with vertical mixing can be explained in terms of Figure 8. It can be observed that although the ocean surface got colder after the hurricane passed in both 2008 and 2019, on 2019 the waters were much warmer before the hurricane. This gives a hint that not only the cold water after the hurricane is relevant, but also the relative change in SST might be an important factor to explain vertical mixing by hurricanes, and thus, its impact on the size of the hypoxic zones.
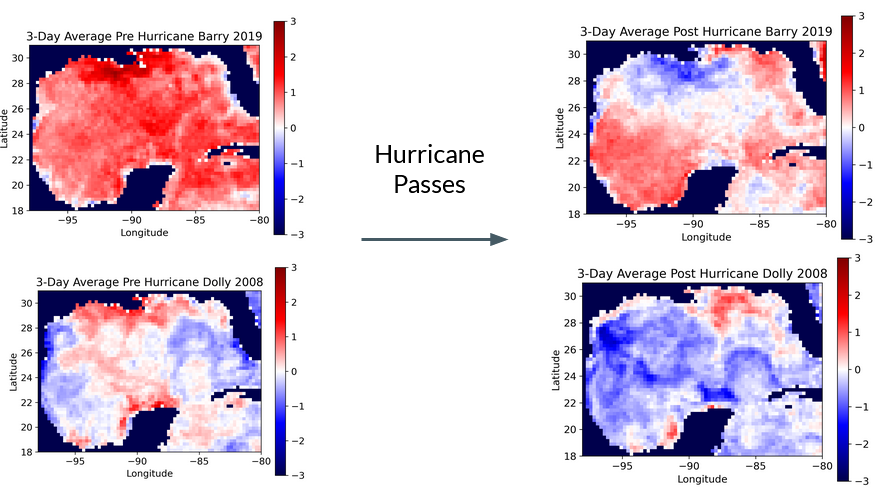
Figure 8: 3-days averaged SST anomalies before and after hurricane Dolly (2008) and hurricane Hanna (2020).
It can be observed how in both cases the ocean surface got colder after the hurricane passed. It is instructive
to notice how the ocean surface in 2019 was significantly warmer before hurricane Barry than the ocean
surface before hurricane Dolly in 2008.
In Figure 9, a possible correlation between sea surface temperature and the hypoxic zones extent is illustrated. The green line is the ratio of the observed size of the hypoxic zone to the predicted one. The forecasted size is calculated mainly in terms of the nitrate load while the observed size accounts for the extreme events that might have dissolved the hypoxic zone. Therefore, the ratio of these two quantities is hypothesized to account for the impact of vertical mixing on the size of the hypoxia. The blue line in this figure is the percentage of the Gulf of Mexico area that got colder after the hurricane. Thus, the blue line indicates that hurricane Hanna mixed the ocean more than Barry, which mixed the ocean more than Dolly. More vertical mixing should indicate more oxygen and therefore a smaller hypoxic zone. The trend of the green line seems to indicate that this is indeed the case: in 2020, the hypoxic zone was smaller (with respect to the forecast) than in 2019, which was smaller than in 2008. Therefore, based on these case studies, there seems to be a correlation between the changes in sea surface temperature and the size of the hypoxic zone in the Gulf of Mexico.
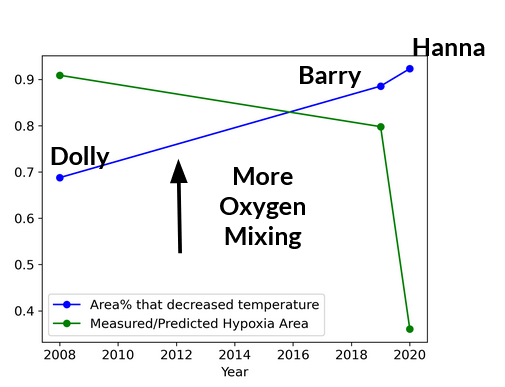
Figure 9: Correlation between SST and the size of the hypoxic zones is illustrated.
The green line is the ratio of the observed size of the hypoxic zone to the predicted one.
The blue line is  is the percentage of the Gulf of Mexico area that got colder after the hurricane.
In Summary:
Hypoxic Zones can be enhanced by human activity.
The Gulf of Mexico Hypoxic Zone is correlated with the nitrogen load from the Mississippi river.
Hurricanes and tropical storms mix the water vertically, breaking the hypoxic zone.
By looking at the areas that get colder after a hurricane passes we might be able to infer the impact of the vertical mixing on the size of the Gulf of Mexico hypoxic zone.