I ran the standard electron calibration code over the W production, resulting in the saving of 217,866 tracks that were suitable for calibration study. In the current analysis, some cuts will be relaxed since the goal is not calibration here. Runs before 10085131 were not used because Jan said there was some sort of trigger problem.
In these plots:
E = E_T in 3x3 using ideal gains
p = p from outer helix of track (global if available, primary otherwise)
BSMD[E,P] total ADC = total ADC of 11 strips underneath central tower
Of the 217,866 tracks, 150,605 were associated with a tower hit more than 2.5 sigma above pedestal.
dE/dx is not calibrated, so that cut is not available for electron use.
I then remove tracks with another track pointing to one of the surrounding towers, leaving 96,946 tracks.
At this point, there's no clear E/p peak so things are looking a little troubling.
Fig 1:
Fig 2:
I then apply a cut on BSMDP total ADC > 800.
This leaves only 3,160 tracks, put gives a very significant E/p peak around 0.9.
Fig 3:
When I look at BSMDE total ADC vs E/p, I see that the remaining background is below around 500 ADC, so I add another cut there and remove the rather strong cut on BSMDP.
Fig 4:
I'm left with 20,100 and a very strong E/p peak at just above 1.
Fig 5:
Fig 6: p vs E/p:
Fig 7: E_T spectrum:
Fig 8:
Fig 9 (BSMDE vs E_T): 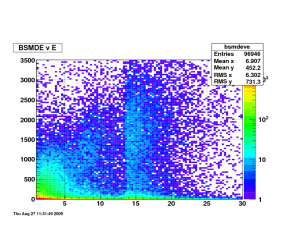
Fig 10 (BSMDP vs E_T): 