- Created by Eric D Miller, last modified by Beverly J LaMarr on Mar 13, 2014 19:49
Any new data products (plots, tables, summaries of work done) should be posted here. I suggest a new titled section for each product or related products, and plots can be attached as PDFs (without a preview) or JPG/GIF/PNG images (which will show up inline). Plots should have some text summary about what they are. And we can link to these from the Outline and Action Items pages.
Contents:
17 Feb 2011 - ACIS peaks and sigmas
24 Mar 2011 - ACIS line fluxes
04 May 2011 - XIS peaks versus COR
04 May 2011 - IACHEC plots: ACIS & XIS peaks, FWHMs & line fluxes
21 Jun 2011 - Is line centroid a good proxy for CTI?
17 Oct 2011 - Figures for paper?
31 Oct 2011 - Trailing charge
31 Oct 2011 - Figures for paper
21 Nov 2011 - OLD Schematic figures for paper
02 Dec 2011 - CTI change at -120C and -90C on ACIS
20 Dec 2011 - Schematic figures for paper
02 Feb 2012 - XIS Perseus analysis for non-CTI changes
09 Feb 2012 - XIS Perseus analysis for non-CTI changes, part II
05 Sep 2012 - ACIS fits with Gehrels weighting
05 Sep 2012 - cal source plots
14 Sep 2012 - XIS fits with Gehrels weighting
14 Sep 2012 - XIS background trend from night Earth data
24 Sep 2012 - new cal source plots
25 Sep 2012 - perseus intercepts
31 Oct 2012 - XIS BG trend from night Earth data, updated
31 Oct 2012 - XIS + ACIS background spectra with lines ID'd
17 Jan 2014 - XIS + ACIS calibration source spectra overplotted
17 Jan 2014 - XIS + ACIS background spectra with lines ID'd, version 2
13 Mar 2014 - new cal source plots
SPENVIS work has its own page: spenvis
17 Feb 2011 - Catherine's attempt to duplicate Bev's monthly XIS plots for ACIS I3 (FI) and S3 (BI). Each data point is a fit to 0.1 years worth of cold ACIS calibration source data, filtered to include only the upper corner regions like XIS and grades G02346. After some testing as to which fitting procedures were less sensitive to background variations (important for ACIS probably not as much for XIS), and robust against low signal-to-noise data, I chose to use a Gaussian plus a linear background component (mpfitfun.pro with some limits to prevent non-physical fits).


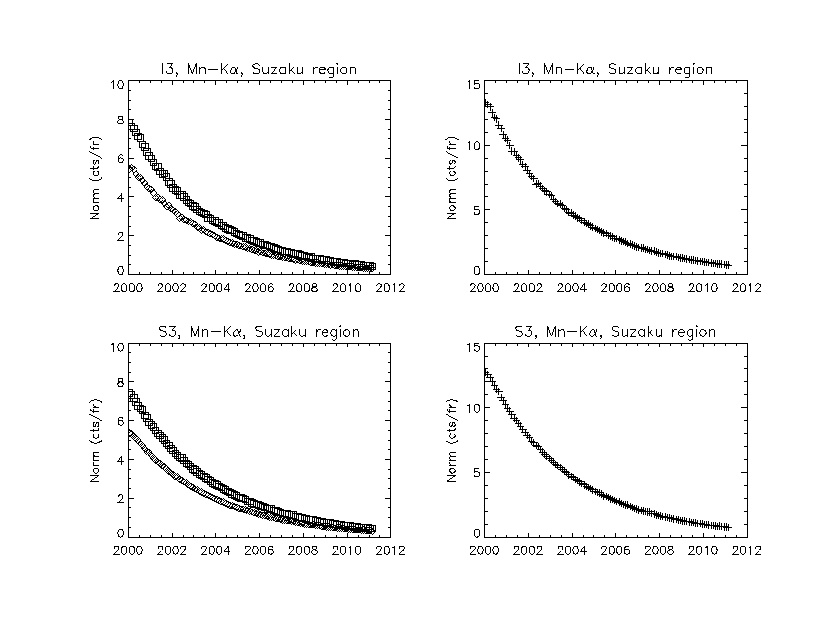
24 Mar 2011 - CEG - The line normalizations that come out of the above fits. The first is a linear plot of the normalization versus time showing the obvious signature of radioactive decay. (Edit added later: line normalizations is bad terminology. What I mean is the counts under the peak (Gaussian norm * Gaussian sigma * 2.51) divided by the exposure time)

Then comparing the data to the expected half-life of 2.737 years for Fe-55. There is clearly a slow reduction in quantum efficiency of 5-10% over the entire 11 years.

To confirm the source of the quantum efficiency reduction, here is the same plot, but for fits from the data in the lower corners of the CCD - closest to the framestore. There is no reduction in quantum efficiency for these data, indicating that the drop is due to increased CTI. Increased CTI leads to more charge trailing and more events morphing from acceptible to bad grades. CTI correction (the default in standard processing but not used here), would remove most of the QE drop.

May 4, 2011 - Bev
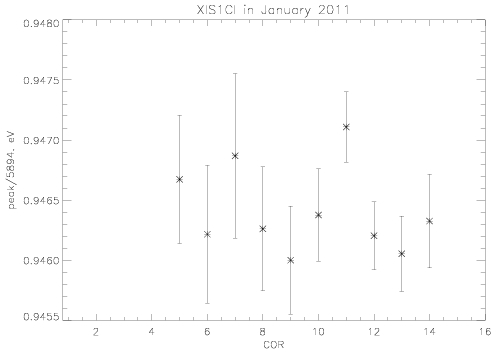
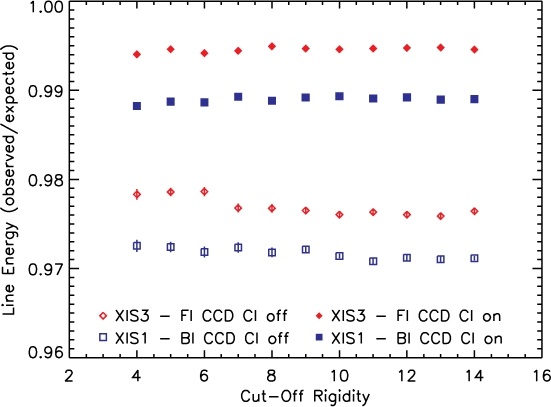
XIS peak location vs Cut Off Rigidity for recent times (201101).


while the last points of xis3 (FI) seem a bit odd, but neither the FI nor the BI are well fit with a line. The peak locations are not a function of the background variations.
Here are plots of the xis1 (BI) high energy count rate vs cut off rigidity to compare to the ACIS s3 (BI) high energy reject rates used to track the background levels for ACIS.
For January 2011:

For November 2006:

May 4, 2011 - Catherine
The plots from my IACHEC talk which are possibly paper-worthy plus some text.

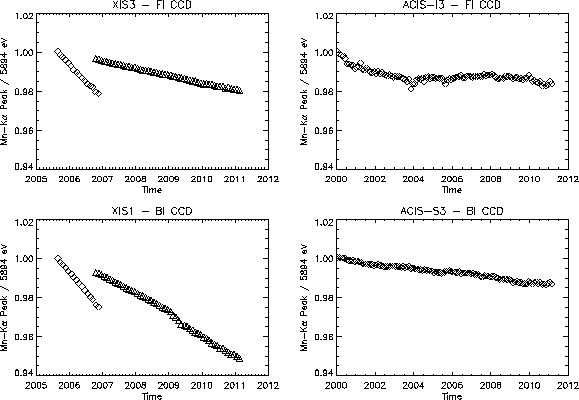
The fractional change in the centroid of the Mn-Kalpha line as a function of time. The left panels are for the XIS detectors on Suzaku and the right panels are ACIS on Chandra. The top panels are representative front-illuminated devices (XIS3 and ACIS-I3) while the bottom are back-illuminated (XIS1 and ACIS-S3). The triangles indicate XIS data with charge injection turned on - ACIS does not have the ability to inject charge.
The change in the line centroid in the absence of any other gain or electronic changes, can be used as a proxy for the change in charge transfer inefficiency (CTI). Radiation damage increases CTI, which in turn decreases the line centroid for data far from the detector readout. The decrease in the line centroid for both XIS and ACIS is due to increasing CTI from radiation damage. Turning on the charge injection for XIS both improved the CTI and decreased the rate of change of CTI.
The rate of change for the two instruments is quite different. The front-illuminated device XIS3, even with charge injection turned on, has a centroid decrease that is roughly 5 times larger than ACIS-I3, while the back-illuminated device XIS1, with charge injection, has a centroid decrease that is 9 times larger than ACIS-S3. This difference may be due to the much warmer temperatures on XIS (-90C versus -120C), or to the different radiation environment encounter in low- and high-Earth orbit.
In addition, the XIS data appear much smoother than the ACIS data. This is due to the much higher and more variable particle background found in high-Earth orbit. These particles act as the primary source of sacrificial charge which can reduce the effective CTI. Due to the details of the charge trap time constants on ACIS (Grant et al. 2004? need to check this), the front-illuminated ACIS-I3 is more susceptible to sacrificial charge than ACIS-S3.

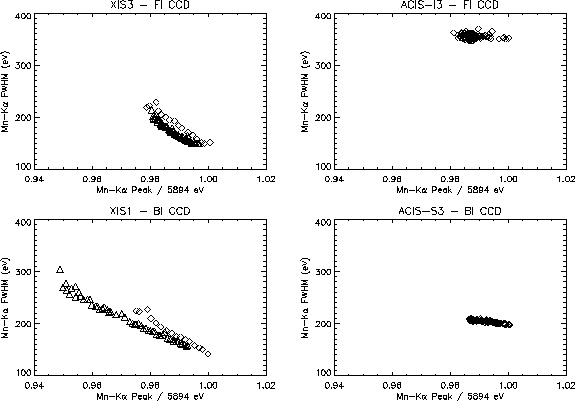
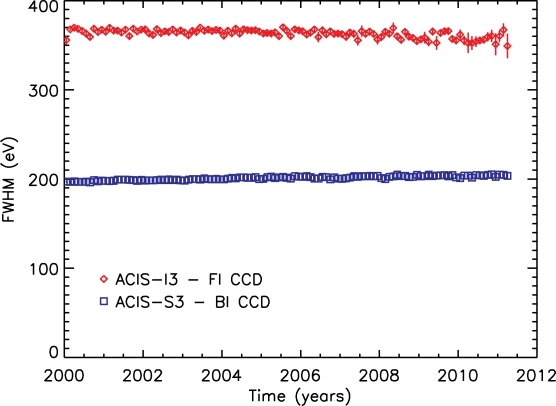
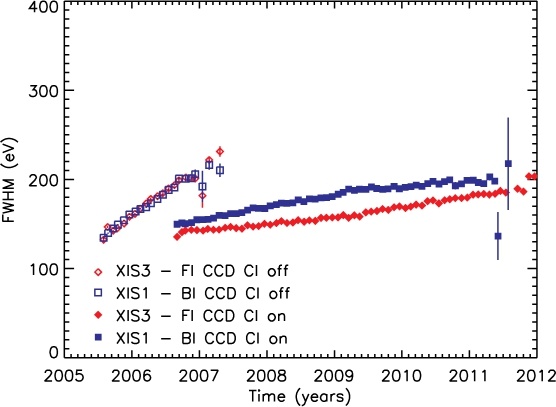
The FWHM of the Mn-Kalpha line as a function of time. Again, the two instruments behave differently. Due to the early damage from passage through the Earth's radiation belts, ACIS-I3 starts with a much higher level of CTI and larger line FWHM. The smaller initial XIS1 FWHM, as compared for ACIS-S3, is due to improvements in manufacturing back-illuminated devices. The XIS FWHM increase with time, while the ACIS FWHM are almost unchanging. Utilizing charge injection reduces the FWHM and the rate of FWHM increase.

The FWHM of a Mn-Kalpha line as a function of the line centroid. While CTI and FWHM should go hand-in-hand, the relationship is clearly complicated, possibly device- and environment-specific.

The counts in the Mn-Kalpha line as a function of time. Most obvious is the decline in counts due to the radioactive decay of the Fe-55 sources (half-life of 2.73 years). The ACIS source is much brighter, at least initially, but both sources suffer from increasingly low signal to noise as the missions continue.

The counts in the Mn-Kalpha line, after removing the 2.74 year Fe-55 half-life, as a function of time. (Not sure the paper needs this one.)
June 21, 2011 - Catherine
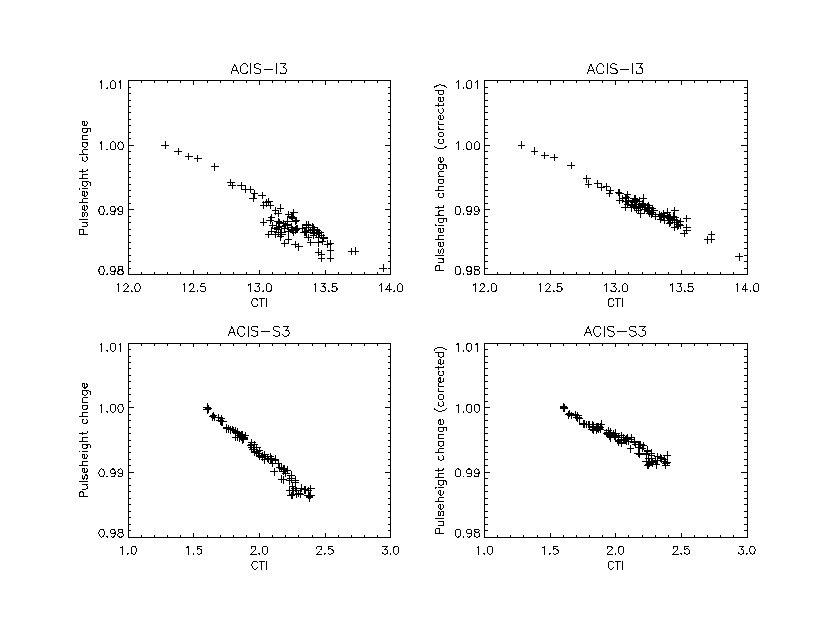
Is the centroid of the Mn-Kalpha line in the upper corners of the CCD a reasonable proxy for CTI?
Yes, with caveats.
A change in CTI must change the accumulated charge loss and thus the pulseheight far from the framestore. A change in pulseheight, however, doesn't necessarily have to be related to CTI - it could also be due to a changes in the gain completely unrelated to radiation damage.
ACIS has a known slow change in the gain as a function of time as measured very close to the framestore where CTI should be negligible. For all of the CCDs except I0 and I2 it is monotonically decreasing at a rate of ~1 ADU/yr at 5.9 keV. (The gain change on I0 and I2 is pathological with jumps and annual trends that aren't relevant, so I don't use them here.) See http://space.mit.edu/~cgrant/gain and http://space.mit.edu/~cgrant/line for example plots.
The figure shows CTI versus the fractional change in pulseheight for the same time bins as all the above plots (CTI x 10^5; fractional change in pulseheight = pulseheight/pulseheight(t=0)). The top two panels are I3, the bottom panels are S3. On the left is the measured data. The CTI and the pulseheight do seem to be correlated with some additional messiness, particularly for I3. The data on the right has had a time-dependent correction applied to the pulseheight data to correct for the slow gain decrease mentioned above. The correction coefficient itself was fit by eye, finding the value that best reduced the I3 scatter. The correction is always less than 0.5% of the total pulseheight.

I'm not sure how well the same type of correction could be made for XIS. What we may need to do is to beef up the error bars on the pulseheight data, to reflect our uncertainty on how well pulseheight works as a proxy for CTI.
(I am also ignoring the issue of changing serial CTI. For ACIS this is negligible, but might not be for Suzaku?)
Oct 17, 2011 - Catherine
Paper appropriate figures?
I've attached the encapsulated postscript files for the figures from my HEAD2011 poster. Not sure if they follow the A&A rules but they have consistent notation with nice thick lines. They use color, but work OK in B/W as well.
ACIS peak vs time
ACIS FWHM vs time
XIS peak vs time
XIS FWHM vs time
XIS peak vs COR
XIS FWHM vs COR
Oct 31, 2011 - Catherine
ACIS trailing charge plots, to be compared to the XIS equivalent here (http://space.mit.edu/XIS/monitor/ccdperf/)

Oct 31, 2011 - Catherine
Figures for paper (new versions)
ACIS peak vs time
ACIS FWHM vs time
ACIS bkg vs time
XIS peak vs time
XIS FWHM vs time
XIS peak vs COR
XIS FWHM vs COR
Nov 21, 2011 - Eric
Schematic figures for paper (removed)
Dec 2, 2011 - Catherine
CTI change at -120 and -90C on ACIS
At my review, Mark and I talked about the problem of separating the different radiation environment from the different focal plane temperatures. I remembered that we had taken data with ACIS at -90C at two different times, in Sept 1999 and Aug 2005, so we can at least see how different the CTI evolution is on ACIS at both temperatures.

ACIS peak vs temperature for S2 and S3
The top panel is for ACIS-S2, the bottom for ACIS-S3. (There's isn't any data for I3 in 1999, so I've switch so S2 which is also an FI device but has higher CTI.) The data points are showing the centroid pulseheight as a function of focal plane temperature (measured in the same regions and the same way as everything above.) The later data has lower pulseheights which is consistent with the CTI increase. For both devices the size of the increase is larger at -90C than it is at -120C.
More specifically...
- S3 at -119C, the peak drops by 0.8%
- S3 at -90C, the peak drops by 2.1%
- S2 at -119C, the peak drops by 2.0%
- S2 at -90C, the peak drops by 9.9%
For S3, the drop is 2.7 times faster at -90C than at -120C. For S2, the drop is 5.1 times faster at -90C than at -120C. To compare to XIS, the FI CCDs on XIS drop 5 times faster than ACIS, the BI CCDs drop 9 times faster than ACIS. (The XIS numbers are with charge injection on, but before the BI charge injection was increased.) So the difference in CTI evolution between ACIS and XIS may be entirely due to the focal plane temperature?
(The FWHM of ACIS-S2 at -90C is so large that the Mn-K line is hopelessly entangled with the Mn-Kbeta and Ti-K lines, so I haven't extended this analysis to FWHM.)
Dec 20, 2011 - Eric (updated from Dec 06, 2011)
Schematic figures for paper (v3)


Feb 02, 2012 - Eric
Analysis of XIS3 Perseus data from 0<ACTY<128, to see how well we might constrain non-CTI gain changes. Line centroid is fit to 0.1%, might have issues from differing kT. These data have been gain- and CTI-corrected, so this is just a proof of concept.


Perseus model spectra with kT = 4 keV and 7 keV
Feb 09, 2012 - Eric
Analysis of XIS1,3 Perseus data, re-PHA'd and re-graded by Bev. GRADE_BEV=0,2,3,4,6 were used along with PHA_BEV, which have no CTI or gain correction. A powerlaw+Gaussian was fit to the Fe XXV K line complex and best-fit center is plotted for segments 1 and 2 (=B and C), and 128-row bins at the bottom, middle, and top of the CCD.

XIS1 Perseus line center trend PDF
XIS1 Perseus fit spectra PDF

XIS3 Perseus line center trend PDF
XIS3 Perseus fit spectra PDF
Sep 05, 2012 - Catherine
Figures 6 and 9 (ACIS peaks and FWHMs vs time) using Gehrels weighting in the fitting and showing the error bars. In general, the errors bars are very small. Gehrels weighting doesn't change the results much.


Sep 05, 2012 - Bev
calibration source plots. I fit the peak in adu for each quad separately, then re-processed using the main fe55 peak as the gain, then plotted quads A&D combined. I normalized by dividing by the total number of counts in the spectrum from 0 to 10 keV but only plotted 1 to 10. g02346 events only.
both side by side
both stacked
acis only
xis only
Sep 14, 2012 - Catherine
Figures 5 (xis peaks vs time), 8 (xis fwhm vs time), 12 (xis peak vs cor) and 13 (xis fwhm vs for) using Gehrels weighting in the fits and showing the error bars. The Gehrels results are similar to what's in the paper except for fwhm vs time which increasing more slowly in the Gehrels fits.


Sep 14, 2012 - Eric
Trend of the XIS NXB from night Earth data, extracting a 512x512 box from the chip center, using only COR2>6 data with normal SCI on (XIS1 at 2 keV level). XIS1 has a clear downward slope of -0.003 cts/s/yr +/- 20%, or about 3% per year. XIS0,3 are consistent with no change. Perhaps this is actually a gain issue with XIS1.
Look at the PDF also.

Update post-meeting: Now including all COR2, 5-15 keV (to reduce gain effects around 7 keV). XIS1 still changes by 4% +/- 1% per year, though with lots of scatter. +/-1-sigma limits for FIs: +0%/-1% (XIS0), +0.5%/-0.5% (XIS3).
Look at the PDF also.

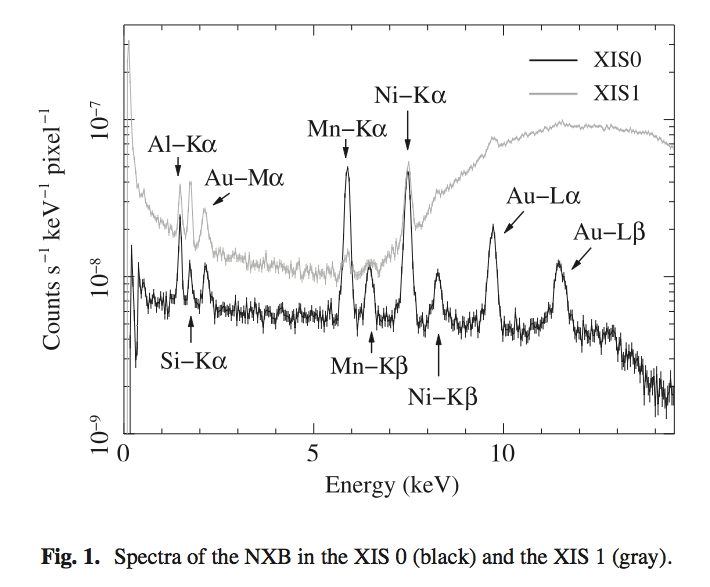
XIS NXB spectra from Tawa et al 2008 (Fig 1):

Sep 24, 2012 - Bev
New version of cal source plots.

eps version for .tex.
Sep 25, 2012 - Bev
I took the intercept of peak vs row for the main iron line in the perseus data
and fit it versus time. The summary is that the intercept is dropping less than half a percent per year for the higher CI levels and less than 1 percent per year for the original, lower, BI level.
CCD |
quad |
CI |
|
adu/year |
error (edu/year) |
|---|---|---|---|---|---|
XIS1 |
c0 |
higher CI |
3 SRs |
-5.39 |
21.81 |
XIS1 |
c0 |
original CI |
12 SRs |
-15.24 |
1.56 |
XIS1 |
c1 |
higher CI |
3 SRs |
1.63 |
3.59 |
XIS1 |
c1 |
original CI |
12 SRs |
-8.94 |
0.47 |
XIS1 |
c2 |
higher CI |
3 SRs |
-2.42 |
4.03 |
XIS1 |
c2 |
original CI |
12 SRs |
-11.25 |
0.48 |
XIS1 |
c3 |
higher CI |
3 SRs |
6.52 |
10.35 |
XIS1 |
c3 |
original CI |
12 SRs |
-11.54 |
1.59 |
XIS3 |
c0 |
FI CI |
13 SRs |
-5.41 |
0.95 |
XIS3 |
c1 |
FI CI |
13 SRs |
-3.66 |
0.32 |
XIS3 |
c2 |
FI CI |
13 SRs |
-3.54 |
0.26 |
XIS3 |
c3 |
FI CI |
12 SRs |
-5.07 |
0.82 |
ps of plots. individual eps files available on request.
Oct 31, 2012 - Eric
Trend of the XIS NXB from night Earth data, extracting all but the cal source regions and bad regions of each chip, using all COR2 data with normal SCI on (XIS1 at 2 keV level). See previous post.
Here it is in 4 week bins, with the XIS1 y errorbars corresponding to the counting statistics. First using FTOOL lcurve:
Second doing this by hand in xselect by and-ing a 4 week time range with the GTIs:

I don't understand the scatter; each bin contains about 50 ksec of data, 1000's of counts, and should span a similar distribution of COR2, yet there is an intrinsic ~ 25% scatter, far higher than the < 5% quoted by Tawa. Restricting COR2>=10 does not change this, nor do larger time bins. Perhaps something is wrong with the GTIs and thus the effective exposure time calculation.
Oct 31, 2012 - Eric
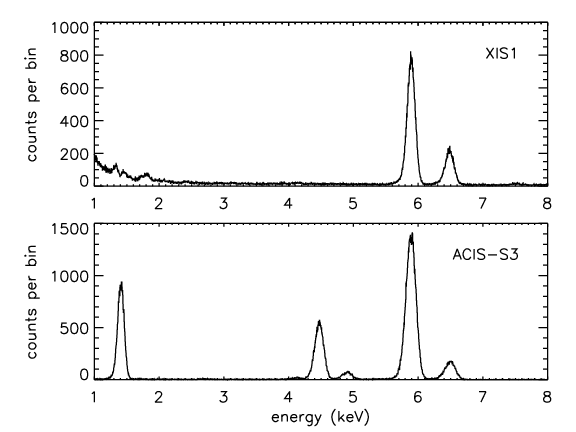
Background spectra for XIS and ACIS with lines ID's a lo Tawa:

Also the EPS for the paper.
Jan 17, 2014 - Bev
Calibration source spectra for XIS and ACIS:

Also the EPS for the paper.
Jan 17, 2014 - Eric
Background spectra for XIS and ACIS with lines ID's a la Tawa,
now with "FI CCD" and "BI CCD" identified.

Also the EPS for the paper.
Mar 12, 2014 - Bev
Calibration source spectra for XIS and ACIS:

Also the EPS for the paper.
| File | Modified | |
|---|---|---|
| JPEG File acis_sigmas.jpg | Feb 17, 2011 15:03 by Catherine E Grant | |
|
Labels
|
||
| JPEG File acis_peaks.jpg | Feb 17, 2011 15:03 by Catherine E Grant | |
|
Labels
|
||
| JPEG File acis_norms1.jpg | Mar 24, 2011 11:49 by Catherine E Grant | |
|
Labels
|
||
| JPEG File acis_norms3.jpg | Mar 24, 2011 11:49 by Catherine E Grant | |
|
Labels
|
||
| JPEG File acis_norms3_bot.jpg | Mar 24, 2011 11:49 by Catherine E Grant | |
|
Labels
|
||
| JPEG File xis1_jan11_nheVcor.jpeg | May 04, 2011 15:09 by Beverly J LaMarr | |
|
Labels
|
||
| JPEG File xis1_jan11_peakVcor.jpeg | May 04, 2011 15:09 by Beverly J LaMarr | |
|
Labels
|
||
| JPEG File xis1_nov06_nheVcor.jpeg | May 04, 2011 15:10 by Beverly J LaMarr | |
|
Labels
|
||
| JPEG File xis3_jan11_peakVcor.jpeg | May 04, 2011 15:14 by Beverly J LaMarr | |
|
Labels
|
||
| JPEG File lb_qe.jpg | May 04, 2011 17:17 by Catherine E Grant | |
|
Labels
|
||
| JPEG File lb_qe2.jpg | May 04, 2011 17:17 by Catherine E Grant | |
|
Labels
|
||
| JPEG File lb_peaks.jpg | May 04, 2011 17:17 by Catherine E Grant | |
|
Labels
|
||
| JPEG File lb_fwhms.jpg | May 04, 2011 17:17 by Catherine E Grant | |
|
Labels
|
||
| JPEG File lb_gf.jpg | May 04, 2011 17:17 by Catherine E Grant | |
|
Labels
|
||
| JPEG File pkcti.jpg | Jun 21, 2011 13:57 by Catherine E Grant | |
|
Labels
|
||
| JPEG File trailplot.jpg | Oct 31, 2011 13:22 by Catherine E Grant | |
|
Labels
|
||
| File acis_peaks.ps Figure for paper | Oct 31, 2011 13:26 by Catherine E Grant | |
|
Labels
|
||
| File xis_fwhms.ps Figure for paper | Oct 31, 2011 13:27 by Catherine E Grant | |
|
Labels
|
||
| File acis_fwhms.ps Figure for paper | Oct 31, 2011 13:27 by Catherine E Grant | |
|
Labels
|
||
| File xis_peaks.ps Figure for paper | Oct 31, 2011 13:27 by Catherine E Grant | |
|
Labels
|
||
| File acis_bkg.ps Figure for paper | Oct 31, 2011 13:27 by Catherine E Grant | |
|
Labels
|
||
| File xis_pkvcor.ps Figure for paper | Oct 31, 2011 13:28 by Catherine E Grant | |
|
Labels
|
||
| File xis_fwhmvcor.ps Figure for paper | Oct 31, 2011 13:28 by Catherine E Grant | |
|
Labels
|
||
| File xis0_20061001to20061130_nheVcor.eps | Nov 15, 2011 14:22 by Beverly J LaMarr | |
|
Labels
|
||
| File xis0CI_20061001to20061130_nheVcor.eps | Nov 15, 2011 14:26 by Beverly J LaMarr | |
|
Labels
|
||
| File ctitemp.ps | Dec 02, 2011 14:39 by Catherine E Grant | |
|
Labels
|
||
| JPEG File ctitemp.jpg | Dec 02, 2011 14:39 by Catherine E Grant | |
|
Labels
|
||
| File xis_schematic.ps XIS schematic (PS for paper) | Dec 20, 2011 11:50 by Eric D Miller | |
|
Labels
|
||
| GIF File xis_schematic.gif XIS schematic (GIF) | Dec 20, 2011 11:50 by Eric D Miller | |
|
Labels
|
||
| File acis_schematic.ps ACIS schematic (PS for paper) | Dec 20, 2011 11:56 by Eric D Miller | |
|
Labels
|
||
| GIF File acis_schematic.gif ACIS schematic (GIF) | Dec 20, 2011 11:56 by Eric D Miller | |
|
Labels
|
||
| ZIP Archive rawPics.tar.gz raw mode images | Jan 19, 2012 12:00 by Beverly J LaMarr | |
|
Labels
|
||
| PDF File ae20070220_0555_0601_xis1_02_sm.pdf Eric's XIS BI raw frame | Jan 19, 2012 12:52 by Eric D Miller | |
|
Labels
|
||
| PDF File i3.obsid55322_00152_bsub.pdf Eric's ACIS FI raw frame | Jan 19, 2012 12:52 by Eric D Miller | |
|
Labels
|
||
| PDF File s3.obsid55322_00152_bsub.pdf Eric's ACIS BI raw frame | Jan 19, 2012 12:52 by Eric D Miller | |
|
Labels
|
||
| PDF File ae20070220_0555_0601_xis0_02_sm.pdf Eric's XIS FI raw frame | Jan 19, 2012 12:52 by Eric D Miller | |
|
Labels
|
||
| File colorBar.eps | Jan 19, 2012 13:03 by Beverly J LaMarr | |
|
Labels
|
||
| Text File edm_rawframes.txt Eric's raw frame selection | Jan 19, 2012 13:13 by Eric D Miller | |
|
Labels
|
||
| File ae20070220_0555_0601_xis3_02_sm.eps XIS FI image with label | Jan 31, 2012 15:41 by Beverly J LaMarr | |
|
Labels
|
||
| File i3.obsid55322_00152_bsub.eps ACIS FI image with label | Jan 31, 2012 15:41 by Beverly J LaMarr | |
|
Labels
|
||
| File s3.obsid55322_00152_bsub.eps ACIS BI image with label | Jan 31, 2012 15:41 by Beverly J LaMarr | |
|
Labels
|
||
| File ae20070220_0555_0601_xis1_02_sm.eps XIS BI image with label | Jan 31, 2012 15:41 by Beverly J LaMarr | |
|
Labels
|
||
| File frame_xis_bi.eps XIS BI image with label, ps2eps-ified | Jan 31, 2012 16:44 by Eric D Miller | |
|
Labels
|
||
| File frame_acis_fi.eps ACIS FI image with label, ps2eps-ified | Jan 31, 2012 16:44 by Eric D Miller | |
|
Labels
|
||
| File frame_acis_bi.eps ACIS BI image with label, ps2eps-ified | Jan 31, 2012 16:44 by Eric D Miller | |
|
Labels
|
||
| File frame_xis_fi.eps XIS FI image with label, ps2eps-ified | Jan 31, 2012 16:44 by Eric D Miller | |
|
Labels
|
||
| JPEG File perseus_102011010_xis3_acty128.jpg XIS3 image of Perseus with low ACTY extraction region | Feb 02, 2012 13:35 by Eric D Miller | |
|
Labels
|
||
| PDF File perseus_102011010_xis3_acty128.pdf XIS3 spectrum of Perseus from low ACTY extraction region | Feb 02, 2012 13:35 by Eric D Miller | |
|
Labels
|
||
| File oPeakSum.eps bright earth between framestore and first CI row | Feb 02, 2012 13:40 by Beverly J LaMarr | |
|
Labels
|
||
| GIF File perseus_102011010_xis3_acty128.gif XIS3 spectrum of Perseus from low ACTY extraction region | Feb 02, 2012 13:44 by Eric D Miller | |
|
Labels
|
||
| PDF File perseus_apec_models.pdf Perseus model, 4 keV and 7 keV APEC | Feb 02, 2012 13:55 by Eric D Miller | |
|
Labels
|
||
| GIF File perseus_apec_models.gif Perseus model, 4 keV and 7 keV APEC | Feb 02, 2012 13:55 by Eric D Miller | |
|
Labels
|
||
| PDF File perseus_gain_xis3.pdf XIS3 Perseus line center trend | Feb 09, 2012 10:28 by Eric D Miller | |
|
Labels
|
||
| GIF File perseus_gain_xis1.gif XIS1 Perseus line center trend | Feb 09, 2012 10:28 by Eric D Miller | |
|
Labels
|
||
| GIF File perseus_gain_xis3.gif XIS3 Perseus line center trend | Feb 09, 2012 10:28 by Eric D Miller | |
|
Labels
|
||
| PDF File perseus_gain_xis1.pdf XIS1 Perseus line center trend | Feb 09, 2012 10:28 by Eric D Miller | |
|
Labels
|
||
| PDF File xis1_all_pha_bev.pdf XIS1 Perseus spectral fits | Feb 09, 2012 10:29 by Eric D Miller | |
|
Labels
|
||
| PDF File xis3_all_pha_bev.pdf XIS3 Perseus spectral fits | Feb 09, 2012 10:29 by Eric D Miller | |
|
Labels
|
||
| PDF File perseusCTI_4bins.pdf plots from failed attempt at running cticalc on perseus evlists | Feb 14, 2012 15:47 by Beverly J LaMarr | |
|
Labels
|
||
| Text File perseus_xis_data.txt Summary of XIS Perseus data | Feb 16, 2012 14:18 by Eric D Miller | |
|
Labels
|
||
| File cor2Plot_20061001to20061130.ps plots of fe55 spectrum vs cor2 | May 21, 2012 11:56 by Beverly J LaMarr | |
|
Labels
|
||
| File perseus_intercept_xis1c1.eps perseus peak intercept, xis1c1 | May 25, 2012 14:23 by Beverly J LaMarr | |
|
Labels
|
||
| File perseus_intercept_xis1c2.eps perseus peak intercept, xis1c2 | May 25, 2012 14:24 by Beverly J LaMarr | |
|
Labels
|
||
| File perseus_intercept_xis3c1.eps perseus peak intercept, xis3c1 | May 25, 2012 14:25 by Beverly J LaMarr | |
|
Labels
|
||
| File perseus_intercept_xis3c2.eps perseus peak intercept, xis3c2 | May 25, 2012 14:25 by Beverly J LaMarr | |
|
Labels
|
||
| File totalCharge_54827_54867.ps total charge above threshold for recent ACIS files | May 25, 2012 15:52 by Beverly J LaMarr | |
|
Labels
|
||
| File totalCharge_ae20070220_0555_0601.ps total charge above threshold - xis files | May 25, 2012 16:25 by Beverly J LaMarr | |
|
Labels
|
||
| Text File XIS1_20061001_to_20061130_cor212.eVSpec.txt xis1 no ci cor2=12 spectrum (text file) | May 31, 2012 12:39 by Beverly J LaMarr | |
|
Labels
|
||
| Text File XIS1_20061001_to_20061130_cor213.eVSpec.txt xis1 no ci cor2=13 spectrum (text file) | May 31, 2012 12:39 by Beverly J LaMarr | |
|
Labels
|
||
| File XIS3_MnKa_spec.eps plots of spectra around Mn Kalpha for XIS3, SCI off and on, 2006-10 to 2006-11 | Jun 08, 2012 11:13 by Beverly J LaMarr | |
|
Labels
|
||
| File ae20070220_0555_0601_totalChargeAbove100.eps xis total charge in pixels above 100 adu | Jun 08, 2012 12:53 by Beverly J LaMarr | |
|
Labels
|
||
| File obsid54827_54867_totalChargeAbove100.eps acis total charge in pixels above 100 adu | Jun 08, 2012 12:53 by Beverly J LaMarr | |
|
Labels
|
||
| Text File ae20070220_0555_0601_totalChargeAbove100.txt xis total charge in pixels above 100 adu | Jun 08, 2012 13:18 by Beverly J LaMarr | |
|
Labels
|
||
| Text File obsid54827_54867_totalChargeAbove100.txt acis total charge in pixels above 100 adu | Jun 08, 2012 13:18 by Beverly J LaMarr | |
|
Labels
|
||
| File checkErr.ps peak v cor2 fits with and without weights | Jul 20, 2012 14:50 by Beverly J LaMarr | |
|
Labels
|
||
| File checkErrMonth.ps monthly fits with and without weights in mpfit | Jul 27, 2012 12:46 by Beverly J LaMarr | |
|
Labels
|
||
| JPEG File acis_peaks_errs.jpg Figure 6, but with Gehrels weighting and showing the error bars | Sep 05, 2012 12:46 by Catherine E Grant | |
|
Labels
|
||
| JPEG File acis_fwhms_errs.jpg Figure 9 but with Gehrels weighting and showing the error bars | Sep 05, 2012 12:47 by Catherine E Grant | |
|
Labels
|
||
| File calSource.eps acis and xis cal source, side by side | Sep 05, 2012 13:49 by Beverly J LaMarr | |
|
Labels
|
||
| File calSource1.eps acis and xis cal source one on top | Sep 05, 2012 13:50 by Beverly J LaMarr | |
|
Labels
|
||
| File calSource_acis.eps acis cal source by itself | Sep 05, 2012 13:50 by Beverly J LaMarr | |
|
Labels
|
||
| File calSource_xis.eps xis cal source by itself | Sep 05, 2012 13:51 by Beverly J LaMarr | |
|
Labels
|
||
| File calSource2.eps calibration source plot with comments incorporated | Sep 07, 2012 16:52 by Beverly J LaMarr | |
|
Labels
|
||
| JPEG File xis_fwhmvcor_errs.jpg | Sep 14, 2012 12:17 by Catherine E Grant | |
|
Labels
|
||
| JPEG File xis_peaks_errs.jpg | Sep 14, 2012 12:17 by Catherine E Grant | |
|
Labels
|
||
| JPEG File xis_fwhms_errs.jpg | Sep 14, 2012 12:17 by Catherine E Grant | |
|
Labels
|
||
| JPEG File xis_pkvcor_errs.jpg | Sep 14, 2012 12:17 by Catherine E Grant | |
|
Labels
|
||
| PDF File box_rates.pdf XIS background trend from night Earth | Sep 14, 2012 12:32 by Eric D Miller | |
|
Labels
|
||
| PNG File box_rates.png XIS background trend from night Earth (PNG format) | Sep 14, 2012 12:33 by Eric D Miller | |
|
Labels
|
||
| PDF File box_rates_cor2_0_99_5p0_15p0_keV.pdf XIS background trend from night Earth (all COR2, 5-15 keV) | Sep 14, 2012 15:36 by Eric D Miller | |
|
Labels
|
||
| PNG File tawa_fig1.png XIS NXB spectra from Tawa et al. 2008 | Sep 14, 2012 15:43 by Eric D Miller | |
|
Labels
|
||
| File calSource3.eps xis and acis cal source spectra, eps version | Sep 24, 2012 10:37 by Beverly J LaMarr | |
|
Labels
|
||
| PNG File calSource3.png xis and acis cal source spectra, png version | Sep 24, 2012 10:37 by Beverly J LaMarr | |
|
Labels
|
||
| File perseus_intercept_gWeight.ps intercepts from perseus data | Sep 25, 2012 14:22 by Beverly J LaMarr | |
|
Labels
|
||
| File perseus_intercept_xis3c2_gWeight.eps | Oct 10, 2012 12:34 by Beverly J LaMarr | |
|
Labels
|
||
| File perseus_intercept_xis1c1_gWeight.eps | Oct 10, 2012 12:34 by Beverly J LaMarr | |
|
Labels
|
||
| File perseus_intercept_xis1c2_gWeight.eps | Oct 10, 2012 12:34 by Beverly J LaMarr | |
|
Labels
|
||
| File perseus_intercept_xis3c1_gWeight.eps | Oct 10, 2012 12:34 by Beverly J LaMarr | |
|
Labels
|
||
| PNG File month_rates_cor2_0_99_5p0_15p0_keV.png XIS background rate "by hand" (4 week bins) | Oct 31, 2012 09:31 by Eric D Miller | |
|
Labels
|
||
| PNG File box_rates_cor2_0_99_5p0_15p0_keV.png XIS background rate via FTOOL lcurve (4 week bins) | Oct 31, 2012 09:31 by Eric D Miller | |
|
Labels
|
||
| PNG File nxb_chandra_suzaku.png XIS and ACIS particle backgrounds w/ lines ID'd for paper (PNG) | Oct 31, 2012 09:31 by Eric D Miller | |
|
Labels
|
||
| File nxb_chandra_suzaku.eps XIS and ACIS particle backgrounds w/ lines ID'd for paper (EPS) | Oct 31, 2012 09:31 by Eric D Miller | |
|
Labels
|
||
| File perseus_interceptN_xis1_gWeight.eps perseus peak intercept normalized - xis 1 | Oct 31, 2012 10:23 by Beverly J LaMarr | |
|
Labels
|
||
| File perseus_interceptN_xis3_gWeight.eps perseus peak intercept normalized - xis 3 | Oct 31, 2012 10:23 by Beverly J LaMarr | |
|
Labels
|
||
| PNG File calSource_oplot.png cal source spectra, overplotted, normalized to Mn Ka counts. png version. | Jan 17, 2014 09:46 by Beverly J LaMarr | |
|
Labels
|
||
| File calSource_oplot.eps cal source spectra, overplotted, normalized to Mn Ka counts. | Jan 17, 2014 09:46 by Beverly J LaMarr | |
|
Labels
|
||
| File nxb_chandra_suzaku_v2.eps XIS and ACIS particle backgrounds w/ lines ID'd for paper, v2 (EPS) | Jan 17, 2014 10:34 by Eric D Miller | |
|
Labels
|
||
| PNG File nxb_chandra_suzaku_v2.png XIS and ACIS particle backgrounds w/ lines ID'd for paper, v2 (PNG) | Jan 17, 2014 10:34 by Eric D Miller | |
|
Labels
|
||
| File calSource4.eps xis and acis cal source spectra, eps version | Mar 13, 2014 19:46 by Beverly J LaMarr | |
|
Labels
|
||
| PNG File calSource4.png new calibration source plot (png version) | Mar 13, 2014 19:50 by Beverly J LaMarr | |
|
Labels
|
||
- No labels