Tank ExperimentThe first experiment was performed with a very slowly rotating tank - moving at just 1 revolution per minute in order to replicate the low latitudes (30ºN and 30ºS).  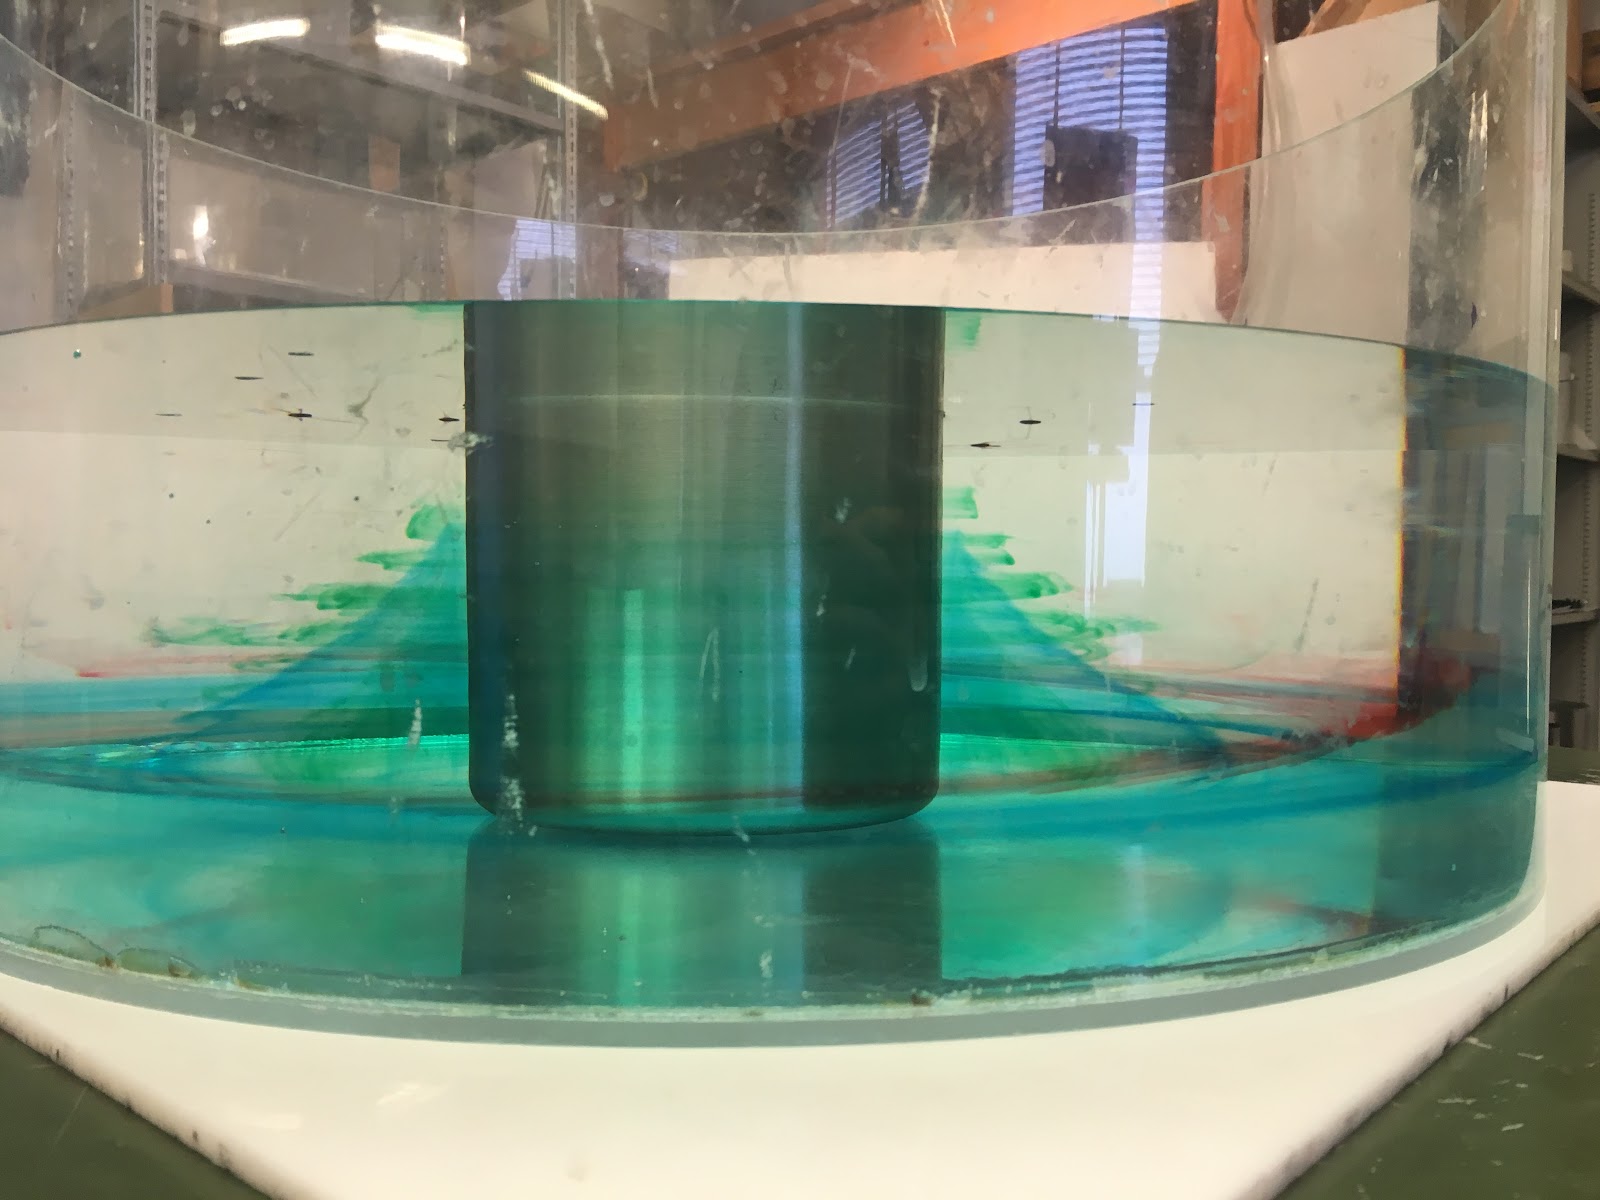
The positions of the particles at the surface could be monitored using a particle tracking software. Data showed that they followed circular paths around the center of the tank. Azimuthal velocities of the particles were calculated to be around 2 cm/s. 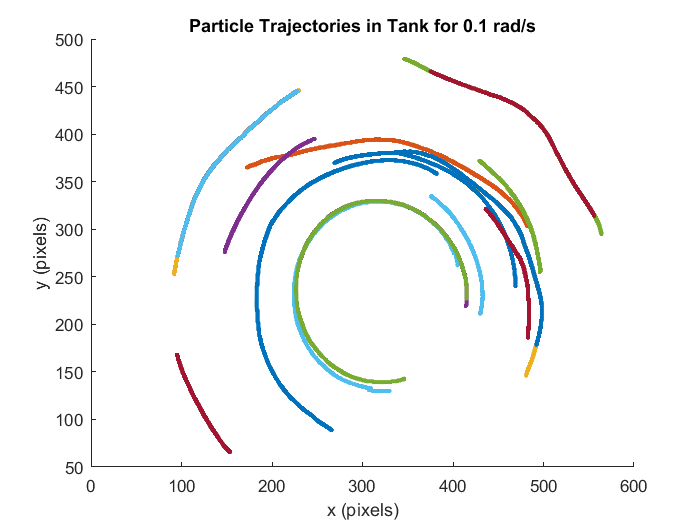
The temperature data from the thermometers revealed that an overall trend of decreasing temperature in the tank, as a result of the melting of the ice. The sensors at the bottom of the tank maintained a near-constant radial temperature over time, of about 4ºC. The temperatures higher up in the tank evolved differently however. The sensor on the edge of the tank measured a high temperature of about 21.2 ºC throughout the experiment, and the one on the ice bucket, gave a reading higher than all but the furthest sensor from the ice bucket at the bottom. These high temperatures are a result of the overturning circulation seen in the non-rotating case as well. Cold water near the ice bucket sinks and spreads along the bottom, leaving the surface water much warmer than that below. 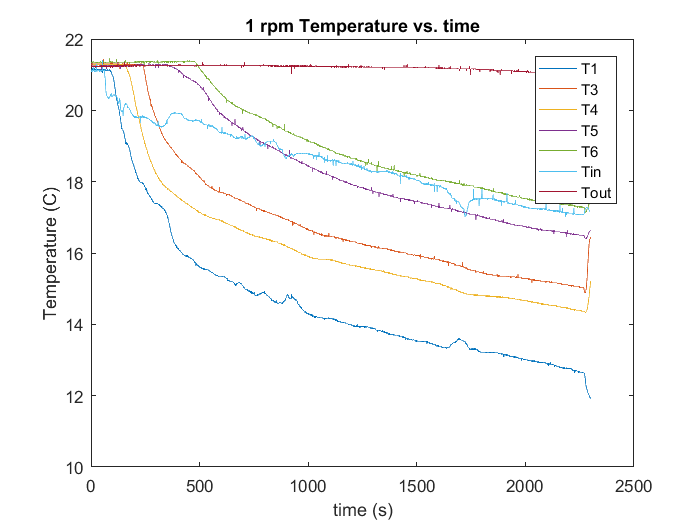
We recall the The thermal wind equation , which describes how a horizontal temperature gradient gradients affects vertical wind shear: 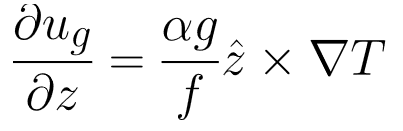
Discretizing the equation and solving for u gives 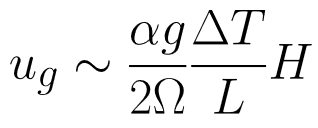
where the coriolis parameter, f, has been replaced by 2Ω, L is the radial distance between the ice bucket and the edge of the tank, and H is the height of the water. We can use the temperature data to calculate the right hand side of the equation, and compare it to the observed surface velocities of the paper dots. 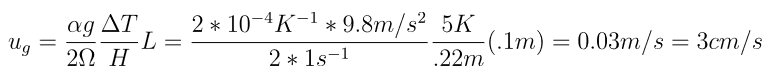
The result is close to the particle velocities found of about 2 cm/s, showing that the theory explains the observed phenomena well within margin of measurement error. |