Overview
Our world is a complex system. Different types of conservation apply in different regions: conservation of energy and conservation of momentum—as already studied in the previous projects.
If we consider the earth as a one big system, we may find that there is not only one large circulation that transport all the heat from the equator to the poles. In fact, there are couple smaller circulations, due to the effects of rotation, that are responsible to for the heat transportation and effects of the angles between the surfaces and the sun. In this study, there are two circulation regimes of interest:
1) The Hadley Cell Circulation: the regime near the equator where the solar radiation strikes the Earth relatively directly and the effects of rotation (Coriolis forces) are small.
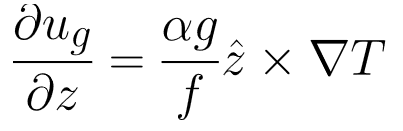
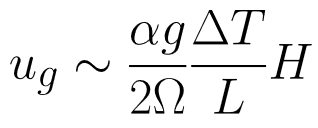
2) The Eddy Cell Circulation: the regime in the mid latitudes where the solar radiation strikes the Earth with relatively indirect and the effects of rotation are slightly biggerADD SOME STUFF ABOUT GENERAL CIRCULATION...
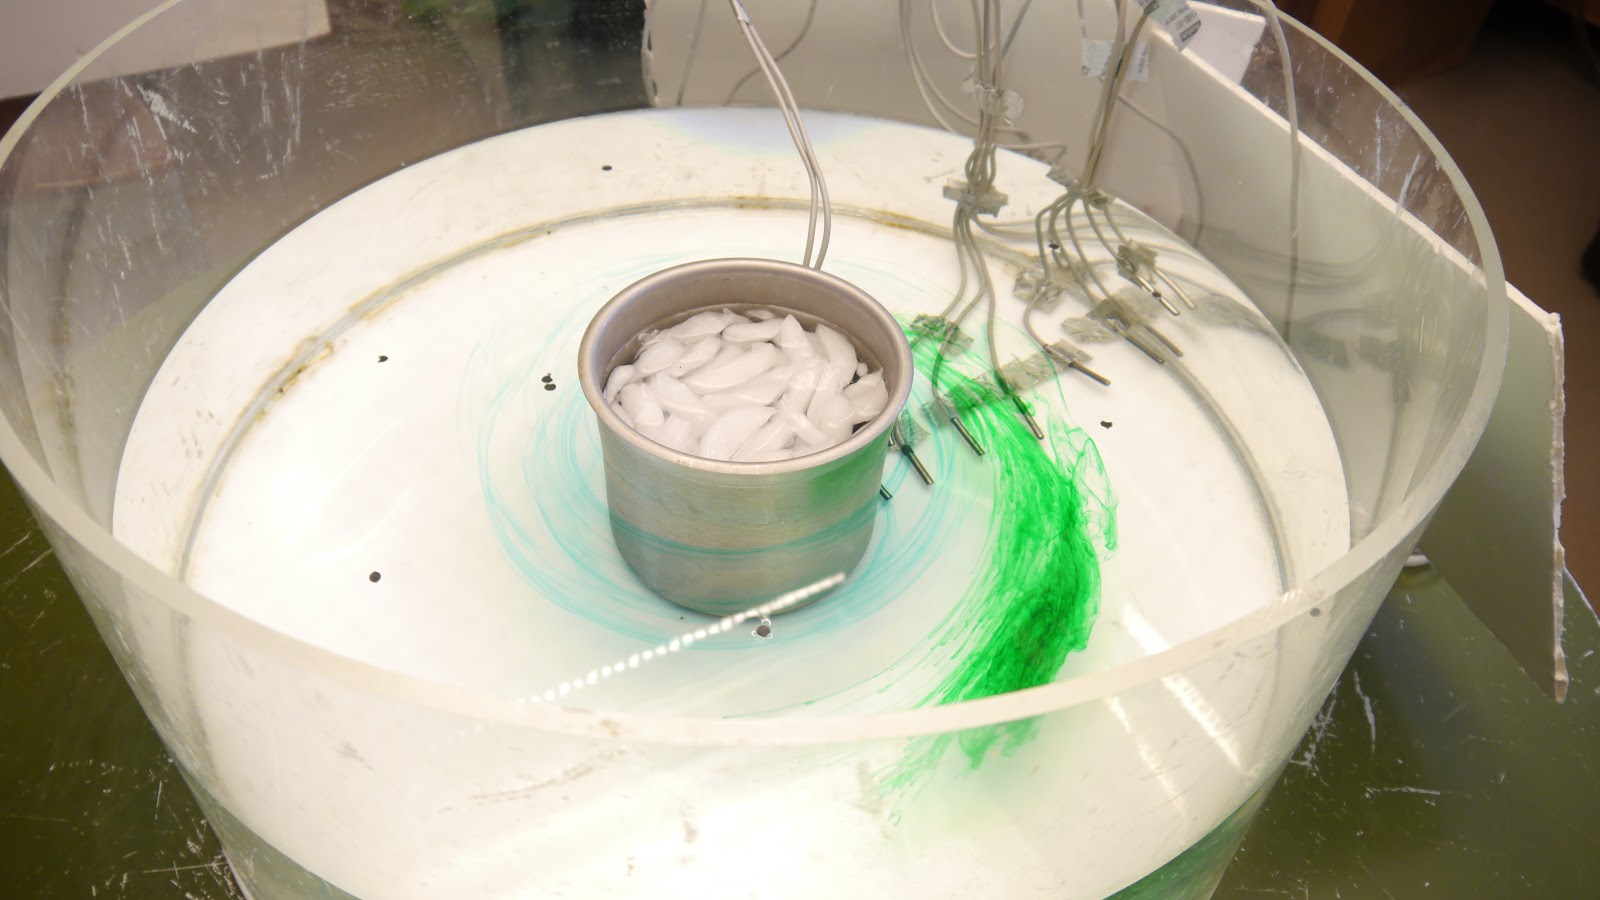
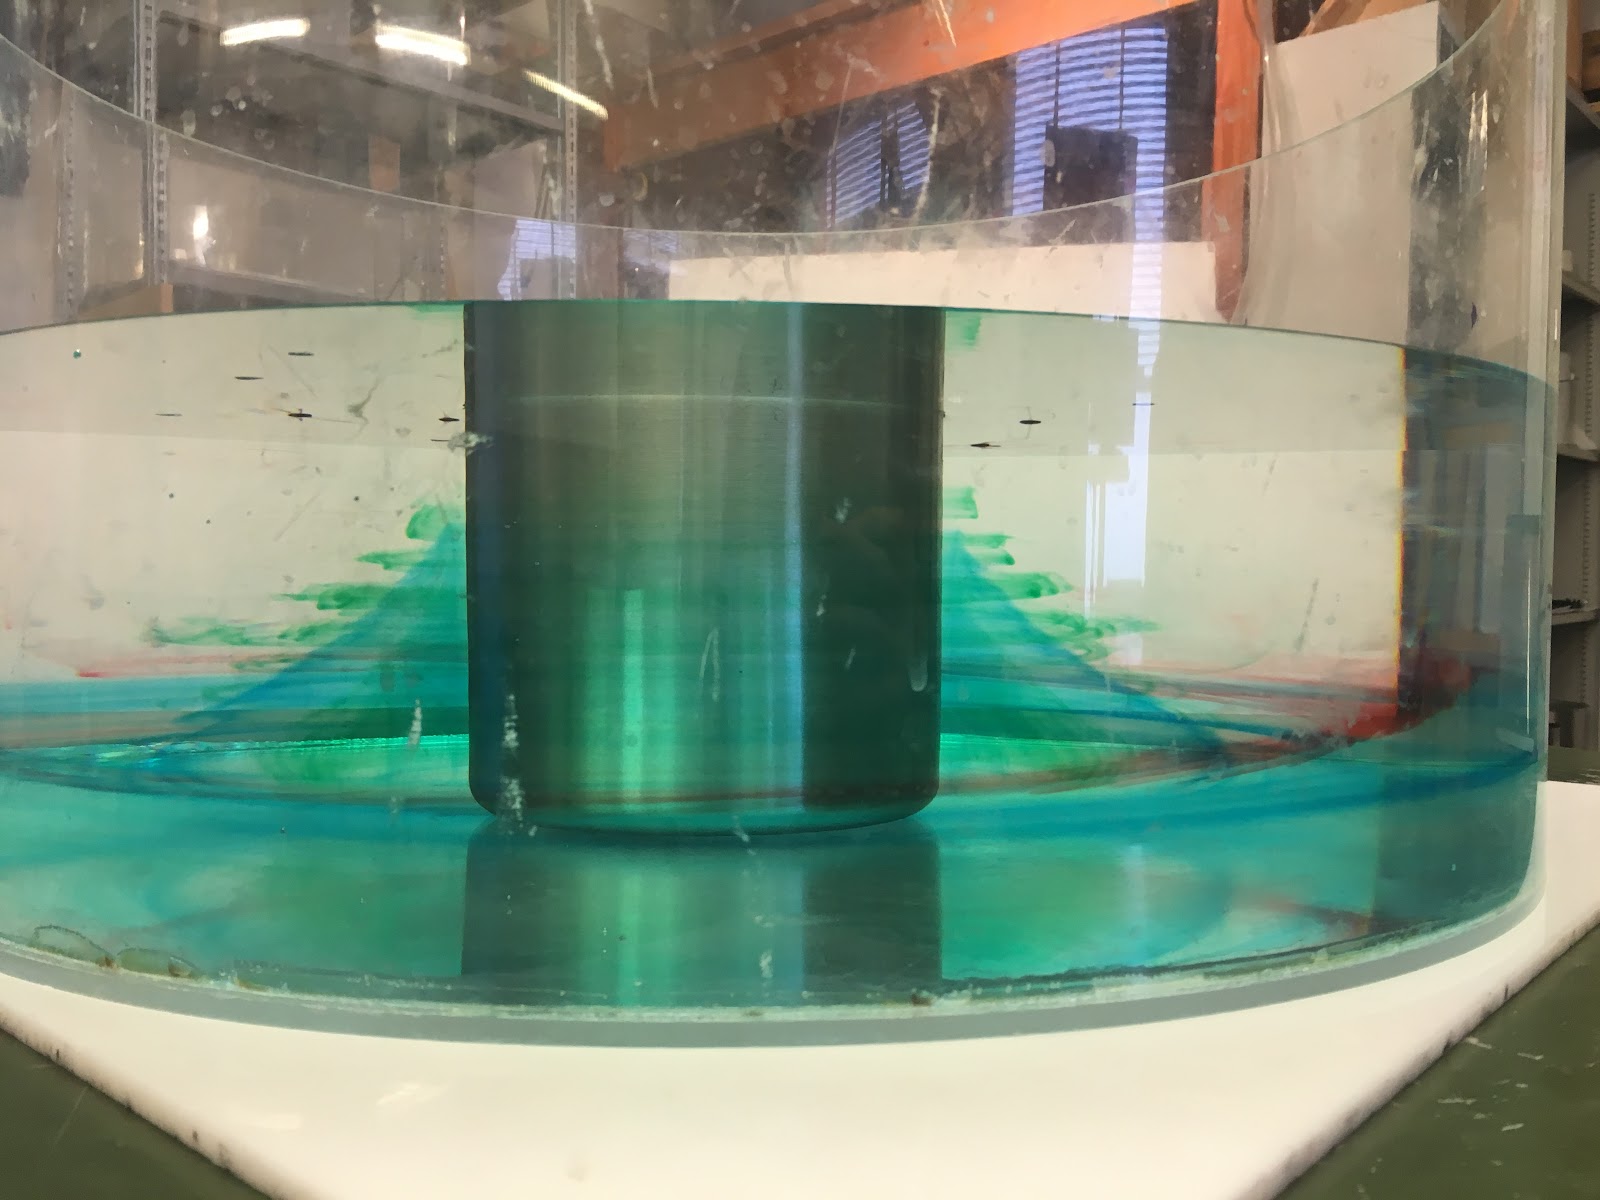
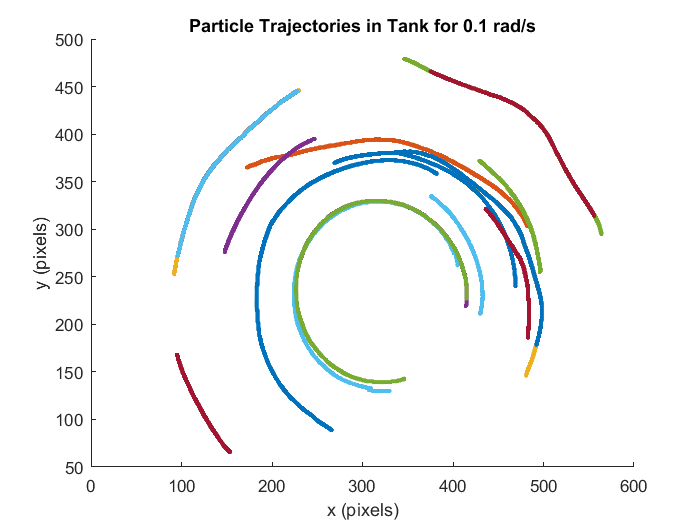
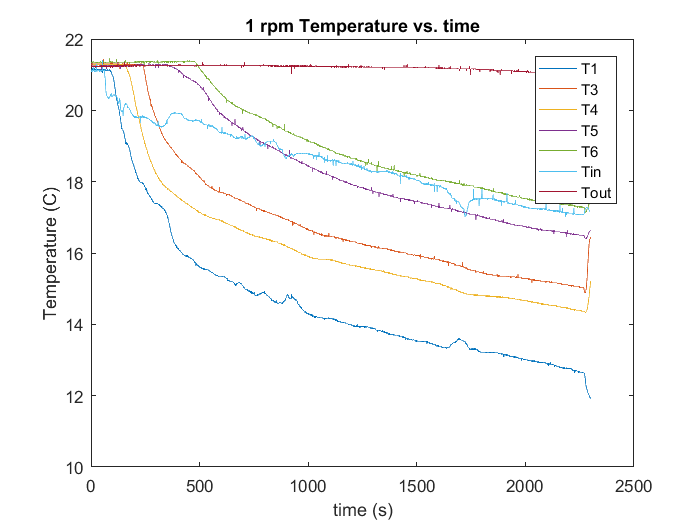
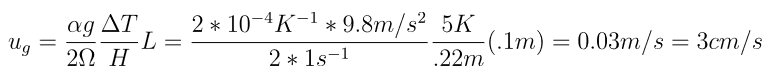
In order to understand the different regimes in the atmosphere, we performed two experiments on rotating tanks of water. Both experiments used the same sized tank, with a metal bucket filled with ice at the center. This setup acted as an analog to the atmosphere on our rotating earth, with the cold polar region reproduced by the ice bucket. Varying the rotation rate of the tank was akin to altering the latitudinal location on the earth. In both experiments, temperature sensors were placed radially along the bottom the the tank to track the movement of heat over the course of the experiment, as well as two 10 cm above - one taped to the ice bucket and one to the edge of the larger tank. Particles were also dropped onto the water to track surface motion, and drops of dye used to visualize flows.
| Section | ||||||||||
|---|---|---|---|---|---|---|---|---|---|---|
| ||||||||||
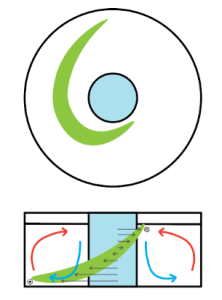
HadleyAt low latitudes near the equator, atmospheric circulation is mostly axisymmetric. Warm air rises at the equator, moves to about 30ºN or south, where it then descends and returns to the equator. This circulation is called the Hadley Cell, which we will explore in more detail in this section.
|

...