...
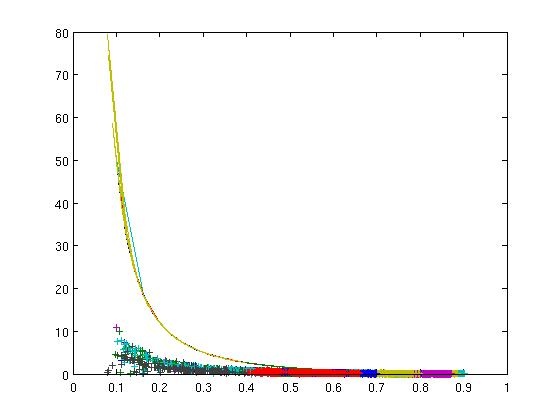
This was our first plot of theoretically predicted Rossby number with our experimental data. Note that the fit is terrible!
We think that this result was due primarily to the angular momentum not actually being constant. After all, there is a net loss of mass through the hole in the center of the tank. If we look at a plot of angular momentum per unit mass versus radius, we see that it is, in fact, not constant, but varies by .
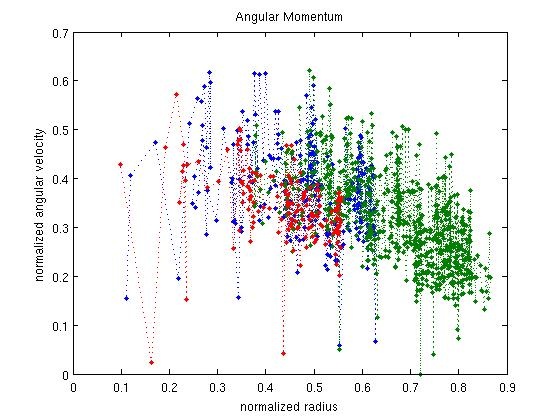
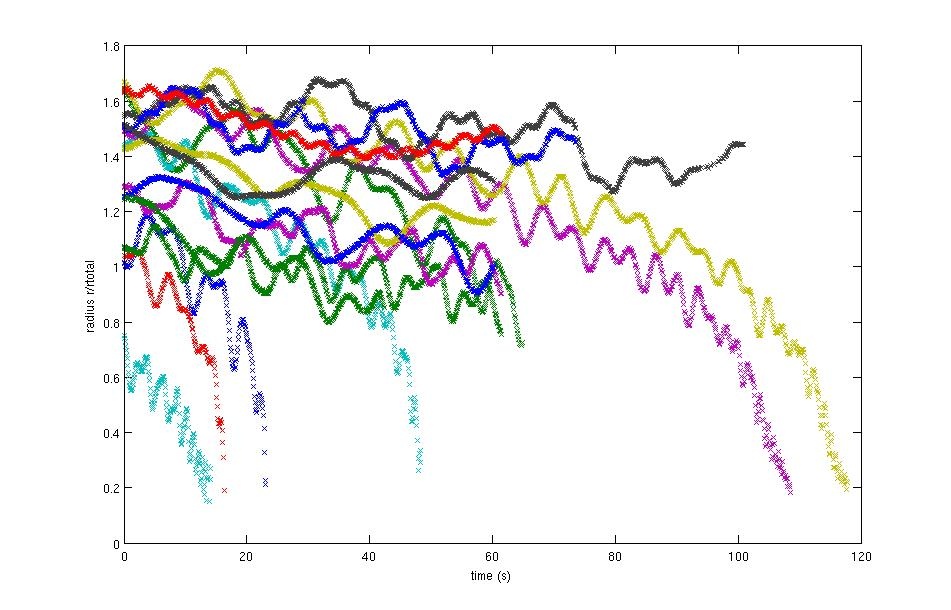
We tried, but failed to correct for the oscillations shown below. I thought it would be a fairly straightforward couple of sinusoidal oscillations added onto the smooth motion we'd expect, but Fourier-transforming the results resulted in gibberish.
Analysis of Hurricane Gustav
...
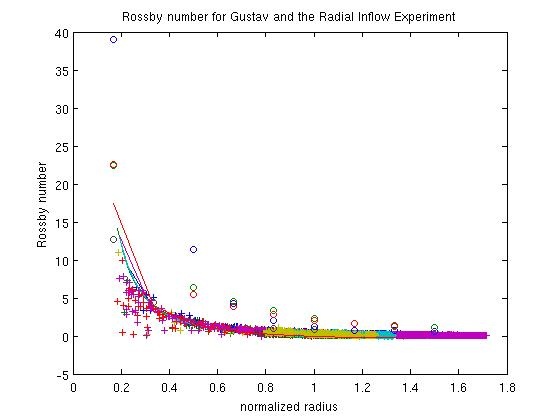
Graph of Rossby number using scaled radaii for Gustav (’o’), and the radial inflow experiment
(’x’), and the theoretical prediction (straight line.):
As you can see, they're quite close!