...
We selected the 4 paths for analysis. The first two were along the center longitude line, first going north from the center and then going south from the center. The other two were along the center latitude line, first going east from the center and then going west from the center. These paths were chosen for ease of calculation.
Data Analysis
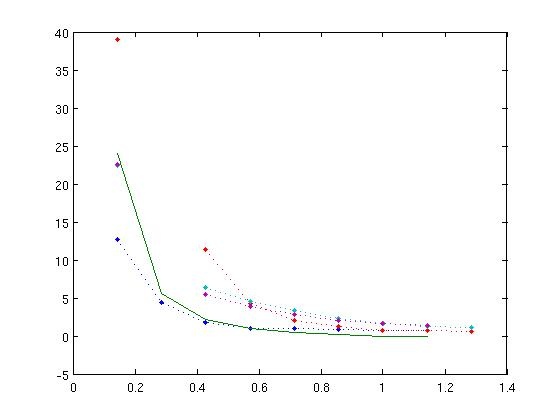
This is a graph of the Rossby number calculated for the paths we selected in hurricane Gustav. The solid line is the theoretical prediction. Again, when we computed the Rossby number using an unscaled raidus, the fit we got was terrible, so we scaled the hurricane's normalized radius by
Friction Exists in the real world
...