...
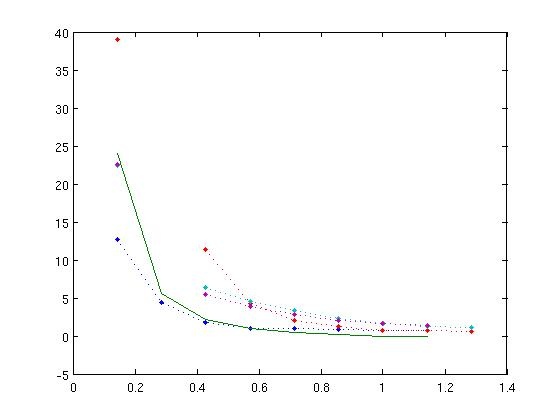
This is a graph of the Rossby number calculated for the paths we selected in hurricane Gustav. The solid line is the theoretical prediction. Again, when we computed the Rossby number using an unscaled raidusradius, the fit we got was terrible, so we scaled the hurricane's normalized radius by 0.75. It was actually kind of unclear how to define the radius of the hurricane in the first place, so this might not be entirely accurate.
If we look at a graph of observed wind, we see that the wind barbs, cross the isolines, indicating the presence of surface friction. Much like in the radial inflow experiment, this could explain the necessity of scaling our Rossby number.
...