...
We selected the 4 paths for analysis. The first two were along the center longitude line, first going north from the center and then going south from the center. The other two were along the center latitude line, first going east from the center and then going west from the center. These paths were chosen for ease of calculation.
Data Analysis
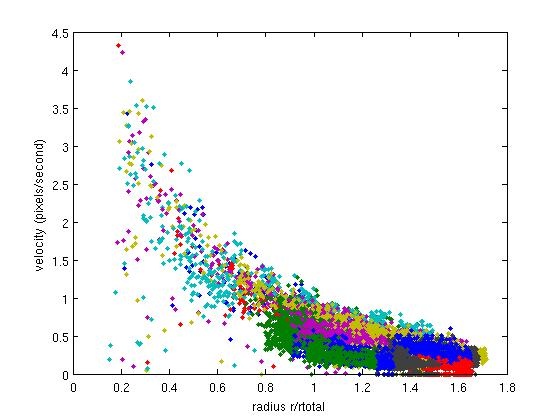
First, looking at v vs r, we find that the particle's velocity increases as it gets closer to the center of the tank, as we would expect from conservation of angular momentum.
This is a graph of the Rossby number calculated for the paths we selected in hurricane Gustav. The solid line is the theoretical prediction. Again, when we computed the Rossby number using an unscaled radius, the fit we got was terrible, so we scaled the hurricane's normalized radius by 0.75. It was actually kind of unclear how to define the radius of the hurricane in the first place, so this might not be entirely accurate.
...