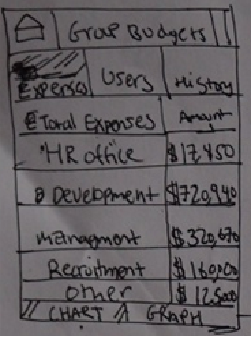
| The Group Budets UI allows people to access and see how various members of a group/organization spend money. The UI allows users to see specific item expenditures, and uses a user’s tab to see a generalized graph of a users spending during a specific period of time.
For Learnability, the UI tries to use the tabs to offer multiple views of the data. Presuming that the user is familiar with a tabbed system to cut the learning curve.
However, again the biggest problem with this visualize is visualizeing the data could become very annoying and overwhelming for the user if they have to see a chart full of hundreds of expenditures. |