In the bottom of this page you find the spectra, responses and background files necessary to reproduce the spectral analysis in Kettula et al., 2013 (A&A, 552, 47) which yielded results summarised in Fig 1. The results correspond to public SUZAKU calibration information in June 2011, i.e. XIS CALDB release
20110608\ and XRT CALDB release 20080709\
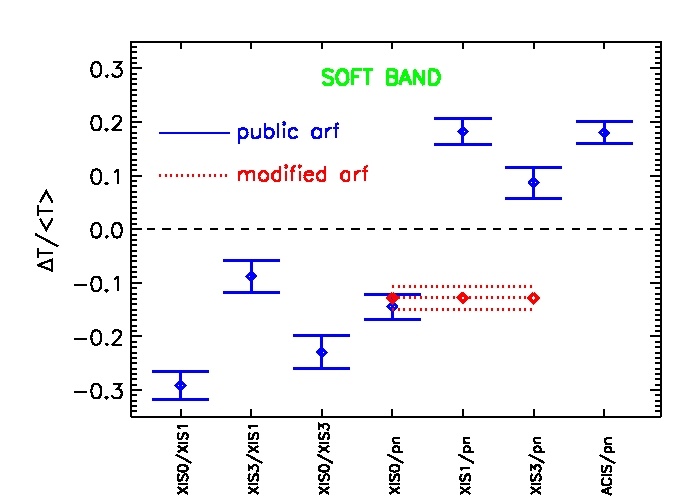
Fig.1: The average relative difference (diamonds) +- the error of the mean of the temperatures for different instrument pairs using the public calibration in June 2011 (blue line) and the modified contaminate used in the paper (red line) in the soft band.
- SUZAKU data are processed with HEASoft3 release 6.11, containing Suzaku ftools version
18 (see details).
- XMM-Newton data are processed with xmmsas 20110223 1801-11.0.0 (see details).
- The spectra are extracted from 3-6 arcmin annulus, centered on the cluster center
- The scripts use a 1-temperature phabs x mekal model.
- The column density is from Kalberla et al. (2005) and the absorption cross-sections are from Balucinska-Church & McCammon (1992).
- The scripts use the metal abundance table from Grevesse & Sauval (1998).
INDIVIDUAL FITS
...
- "X" refers to XIS unit (0,1, or 3)
- "Y" is the cluster name
- "Z" refers to the band used in the fit (0520 = 0.5-2.0 keV; 2070 = 2.0-7.0 keV
- The spectra are extracted from 3-6 arcmin annulus, centered on the cluster center
- The scripts use a 1-temperature phabs x mekal model.
- The column density is from Kalberla et al. (2005) and the absorption cross-sections are from Balucinska-Church & McCammon (1992).
- The scripts use the metal abundance table from Grevesse & Sauval (1998).
JOINT FIT
...