| Include Page | ||||
|---|---|---|---|---|
|
| Panel | ||
|---|---|---|
| ||
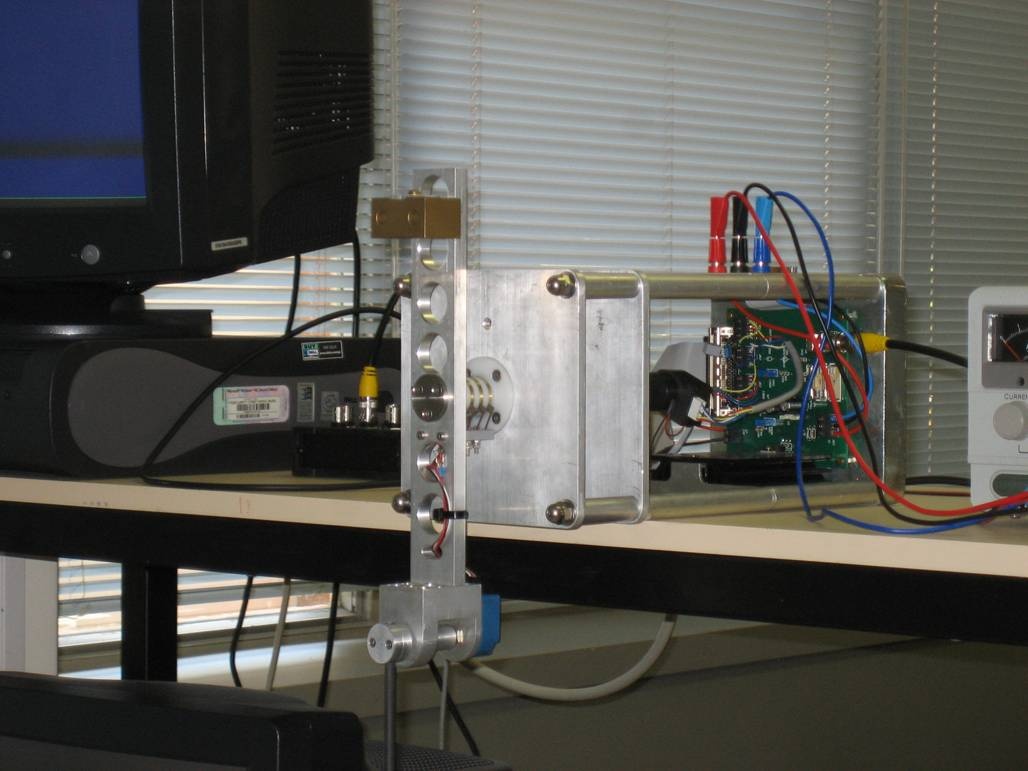
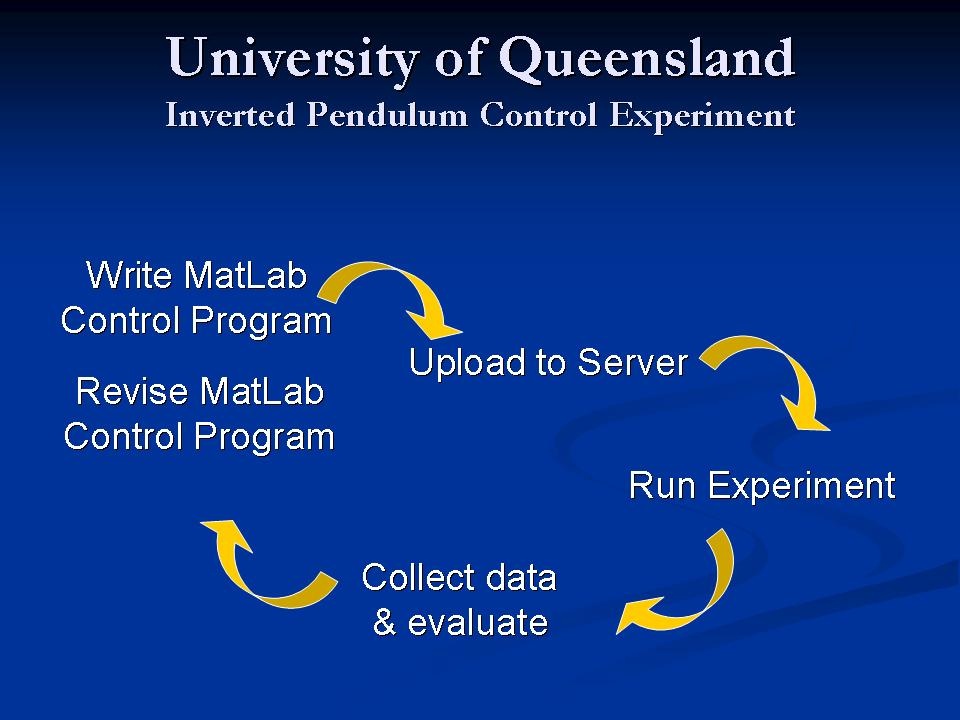
Inverted Pendulum ExperiemntInverted Pendulum is a well known control theory experiment where by control laws are derived and tweaked as to balance a pole much like one balances a broom on their finger. This is a difficult practical run over four weeks in the UQ course METR4202 - Advanced Control and Robotics. The students construct models using Simulink within Matlab on their workstation and compile and run their designs on the hardware through connection to a second machine running the xPC kernel. This machine then directly interfaces with the inverted pendulum hardware. Access to the lab in which the equipment for this experiment resides is limited and students in that course can only use the facilities for a few hours a week during their allotted prac time. Therefore the implementation of this experiment as an iLab would provide a significant increase in its availability to students. This experiment consists of many iterations of design and test. Whilst the mathematical models and computer simulations may successfully balance the pendulum, the actual lab equipment's behaviour is not so ideal. The students could greatly benefit from working with the real equipment whilst they build their early models and perform the many tweaks online, potentially queuing up several variations at once. — Excerpt From Joel Carpenter's thesis
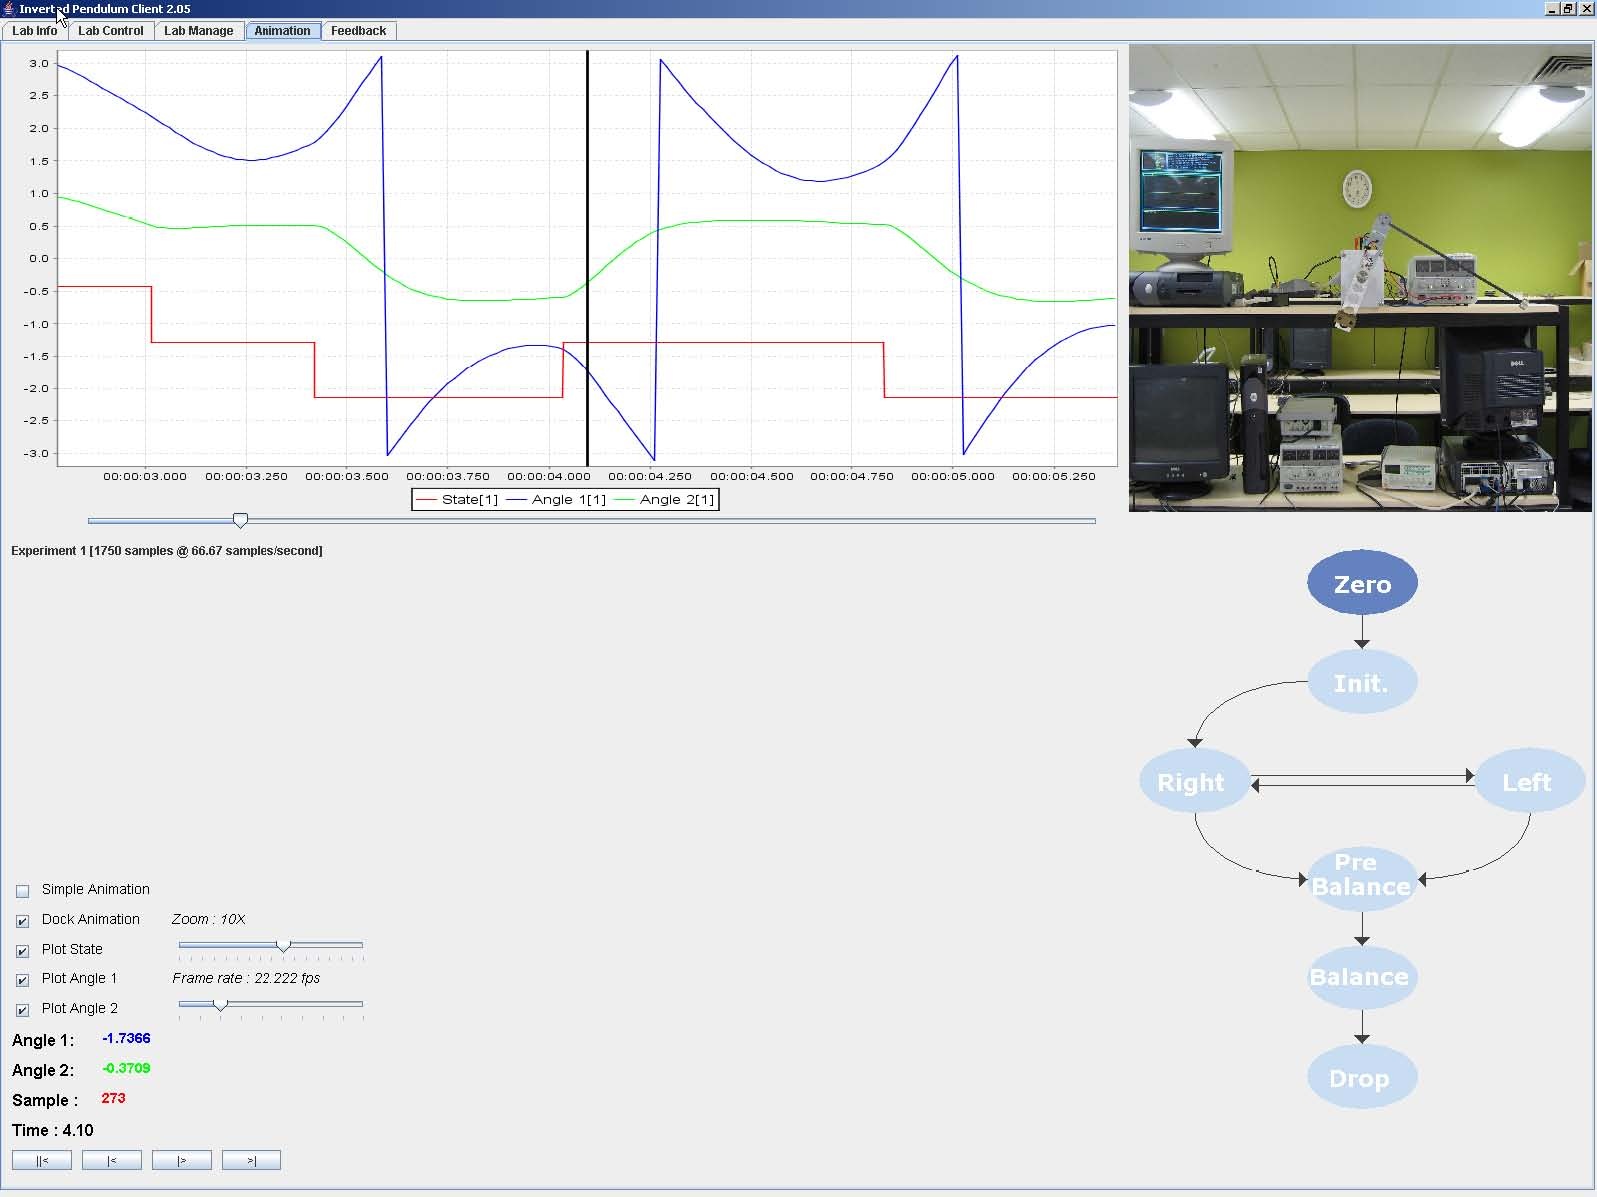
Inverted Pendulum client
|


