...
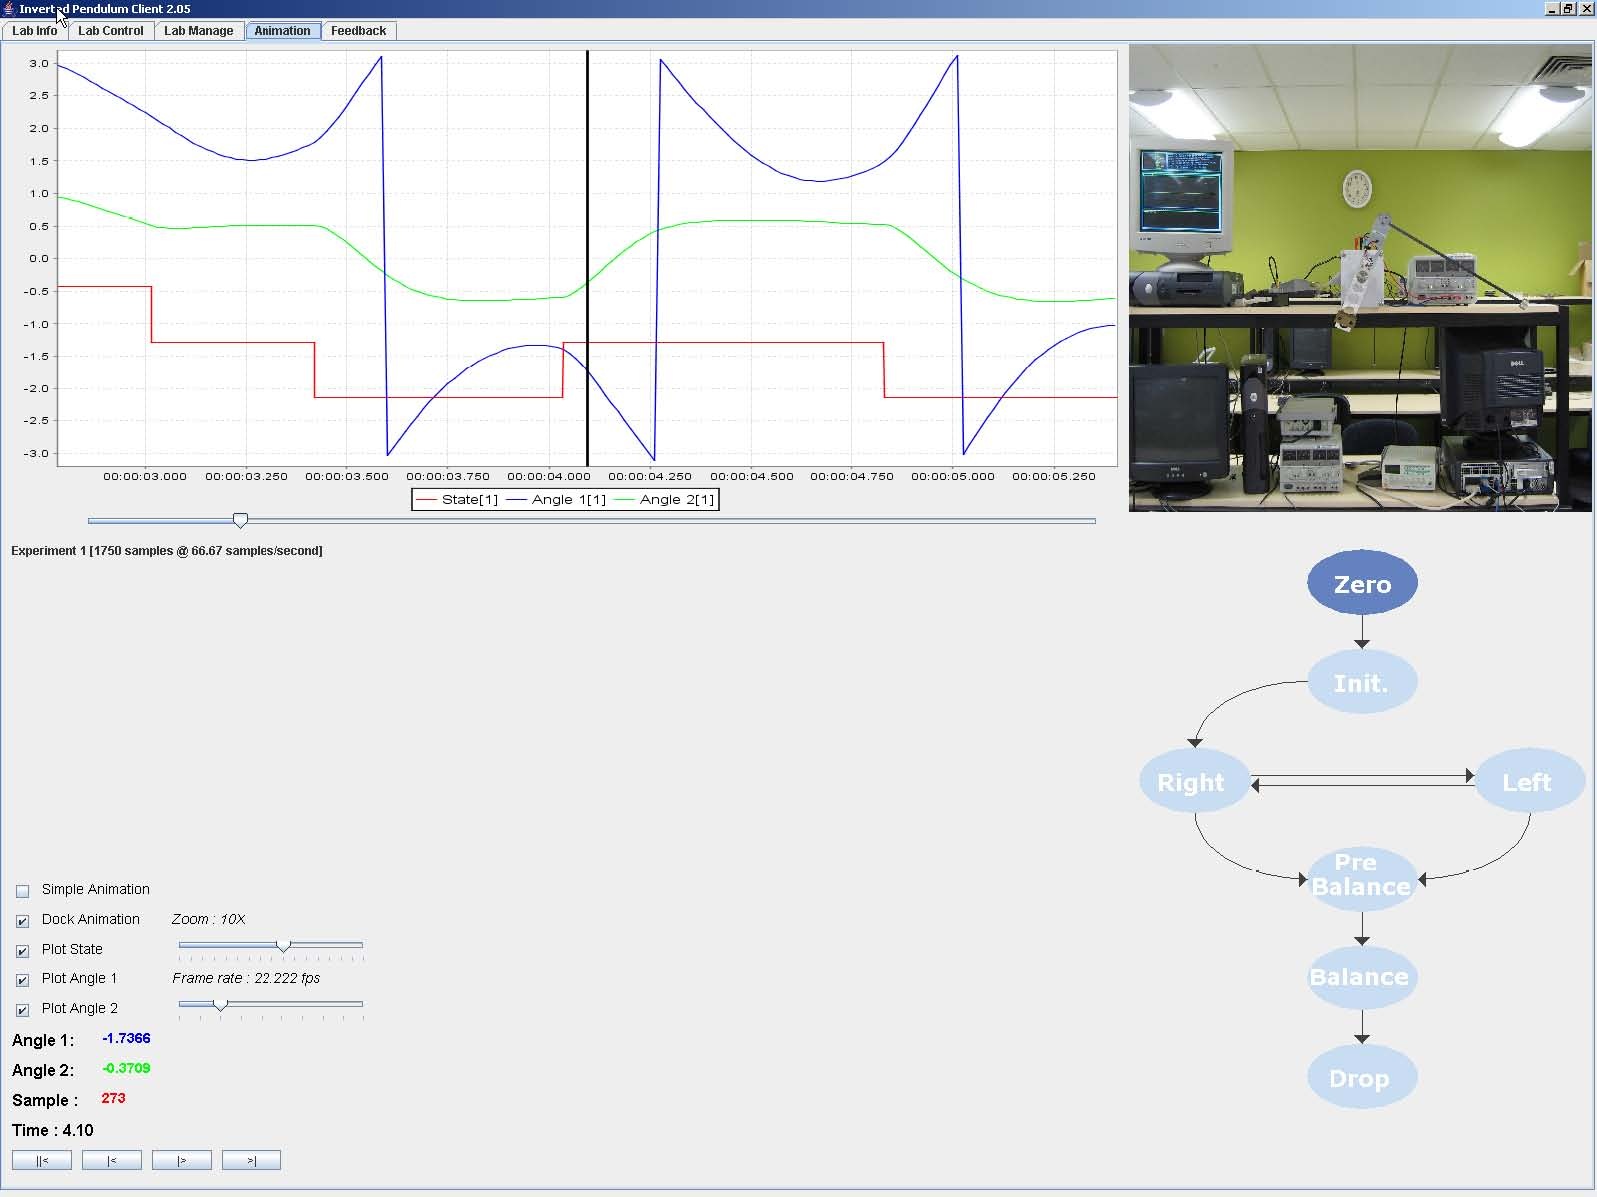
- As the experiment is run, data is graphed and in the upper right corner an animation of the results is diplayed.
- On the right handside of the client a state diagram is dynamically updated to show the current state of the control program.
- On the left handside are client display options. There is also a simple animation.