Force On A Magnetic Dipole
One of the major focuses of the TEAL Project at MIT has been to augment student intuition about abstract physical concepts using active and passive visualizations, especially in areas where we can make the "unseen seen", as in electromagnetism.
We are extending the TEAL emphasis on visualization to on line experiments. These experiments will be controllable remotely by students, and will output a data stream over the web. That data stream will be used as input to drive a real-time virtual representation of the experiment on the student's computer. The virtual experiment will show what is physically happening in the experiment, as well as "augmenting reality" with representations of magnetic and/or electric field lines. The data will also be saved to a file for later (non-real time) quantitative analysis by the student.
This experiment consists of a small magnet suspended vertically by a spring in the center of two horizontally mounted coils (see Figure 1). A video camera is set in position to observe the oscillations of the magnet. The student can choose to have current in the coils run both in the same sense or in the opposite sense in the two coils, and can select a variety of the voltages and waveforms. Once the experiment is started the magnet oscillates vertically (or not) in response to magnetic fields generated in the coils. By using image analysis the position of the magnet is constantly monitored up to 30 times per second. The position of the magnet and the current in the coils are transmitted in real time across the web to drive a virtual representation of the experiment on the student's computer. This visualization is augmented by magnetic field lines computed in real-time from the real-time current and position of the magnet. If desired, the student can also see a visual image of the magnet from the video camera, although because of data rate limitations the refresh time of that image will be low (e.g. once per second).
By knowing the current in the coils, the displacement of the magnet, and the spring constant of the coils, the student can off line compute the magnetic dipole moment of the magnet. The student also can quite clearly see from the field lines generated in the virtual experiment that for there to be a force on a dipole there must be a gradient of the magnetic field at the center of the coils (for current in the coils in the same sense there is no gradient at the center and thus no force; for current in opposite senses there is a large gradient and thus a force.
In Figure 2 we show a screen capture of what the student would see on her computer screen when doing the experiment on line. The left of the screen shows the LabView interface that controls the experiment remotely, with a display of the data returned from the experiment. In the visualization panel to the right, the real-time position of magnet is used to control the position of the "virtual" magnet in the visualization. We augment this representation with the magnetic field lines of the magnet and of the current-carrying coils, computed in real-time using the position of the magnet and current in the coil. The shape of these field lines shows the effects of the pressures and tensions transmitted by the magnetic fields from the coils to the magnet, as illustrated below in passive "movie" visualizations (see Figure 3).
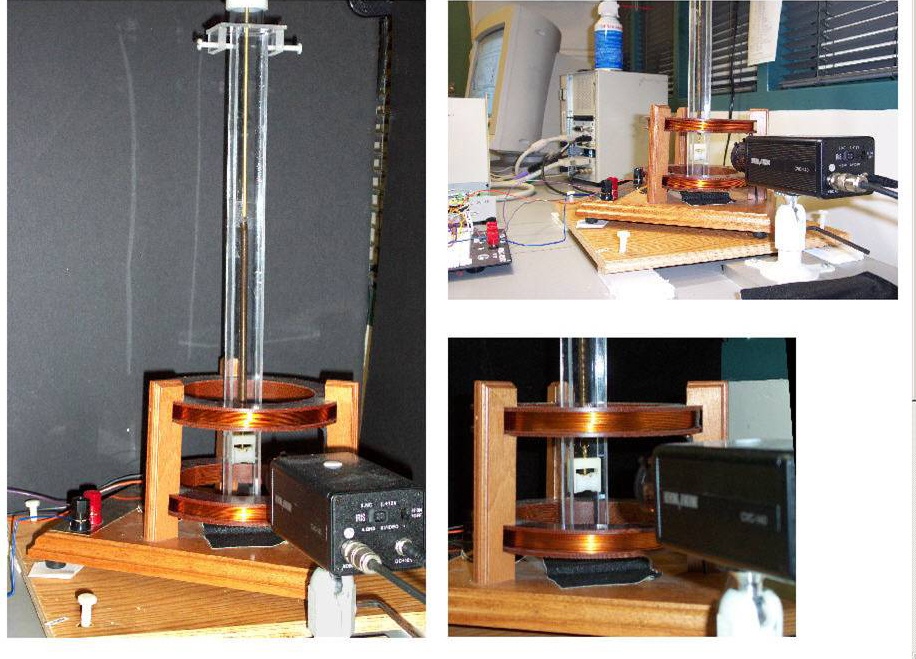
Figure 1: The TeachSpin Magnetic Force Experiment.
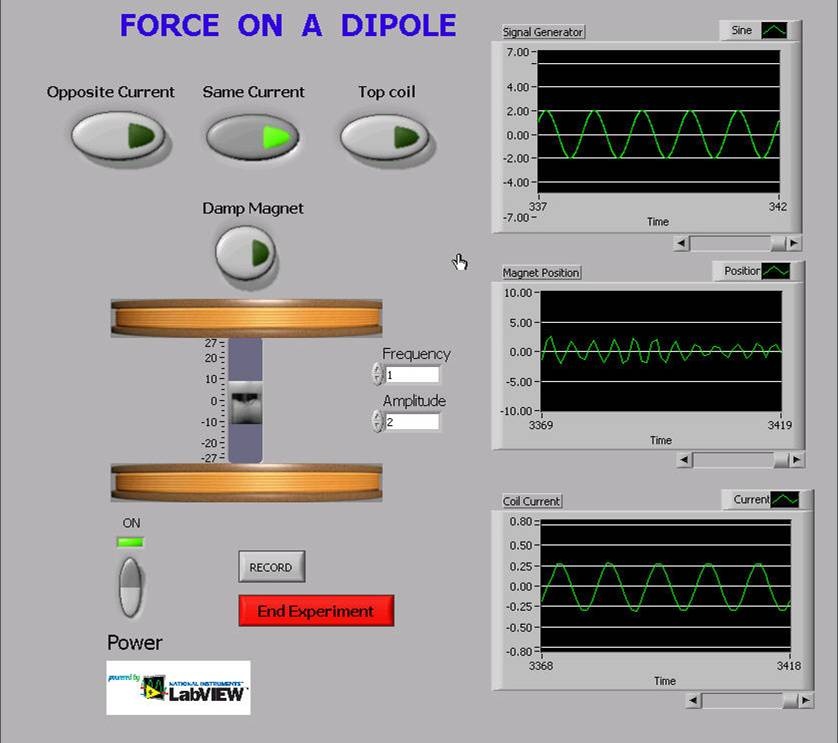
Figure 2: The LabView interface for controlling the experiment.
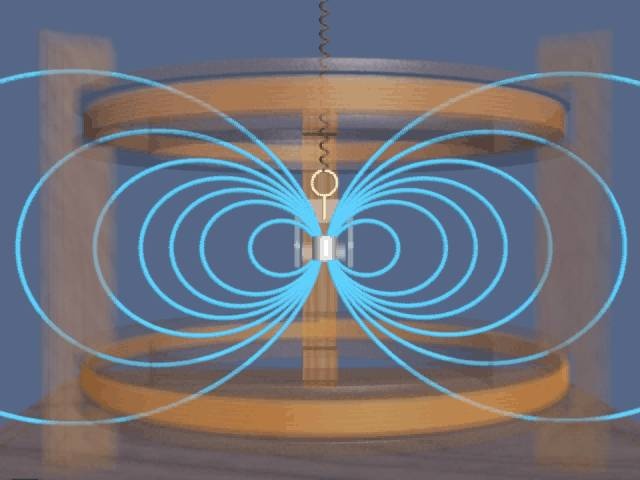
Figure 3: The visualization of the experiment driven by the data stream.
If one views the animations referenced in the Figure 3, one can get an intuitive feel for why in one case (gradient in the magnetic field of the coils) there is a force on the dipole and why in the other case (homogeneous magnetic field of the coils) there is not. This will be more immediate in the real-time virtual experiment driven by the data from the on line experiment. In particular, the student will be able to switch from one configuration to the other, and see the immediate response in the motion of the magnet, reflecting the immediate change in the configuration of the magnet fields. Although the passive animations we have linked to below are much more elegant than the real-time visualization, the real-time visualization will be reasonably attractive (see Figure 2), and has the great advantage that the student can interact with it by changing the experiment parameters.