Multi-Mission Study
Cluster sample
Google spreadsheet of MMS cluster observations
XMM-Newton (Ivan): iachec_clusters_xmm_obs_all.csv (six clusters added to Google sheet)
Chandra ACIS-I (Larry?): IACHEC_Cluster_of_Galaxies_WG.numbers (six clusters added to Google sheet)
Chandra ACIS-S (do we want this? Yes, but concerns about level of BG)
Suzaku XIS (Eric): six clusters added to Google sheet
NuSTAR (Dan): ...
Swift (Andy B): ...
AstroSat (Gulab): ...
HXMT (Chen): Perseus, Coma
NICER (Craig): Craig says: for NICER cluster flux studies, radius is going to have to be < 180 arcsec. We can also enter a surface brightness profile into our ARF generator, but that assumes the spectrum of photons outside FOV is same as those inside. (six clusters added to Google sheet)
ROSAT (Kip or his designate): ...
- Please provide information (OBSID, exposure time) about your mission's best observation of each MMS cluster that matches these criteria (the red clusters in the Google sheet):
- kT > 6 keV (cluster-specific)
- z < 0.1 (cluster-specific)
- 100,000 cts in central 6 arcmin (40,000 for PSPC) (mission-specific)
- center < 3 arcmin off-axis (mission-specific)
- These criteria are a bit flexible, so comments can be added for specific exposures.
- Each mission contact prepare their own table as they wish, and provide to Eric to merge with the existing Google spreadsheet; or they can enter that information by hand on the Google sheet.
- Since the idea is to choose a single observation for each mission for each cluster, it is best for the mission expert to identify that observation. This would also identify which observations have the required 100,000 counts, which hopefully each of us can estimate roughly from the exposure time.
We have a possibility to make one-to-one comparison of a few nearby, relaxed clusters with 6 different satellites (XMM/EPIC, CHANDRA/ACIS-I, ROSAT/PSPC, Suzaku/XIS, Swift/XRT and NuSTAR).
- This is the original project plan. This describes the current status MMS.pdf
- Request to the IACHEC community
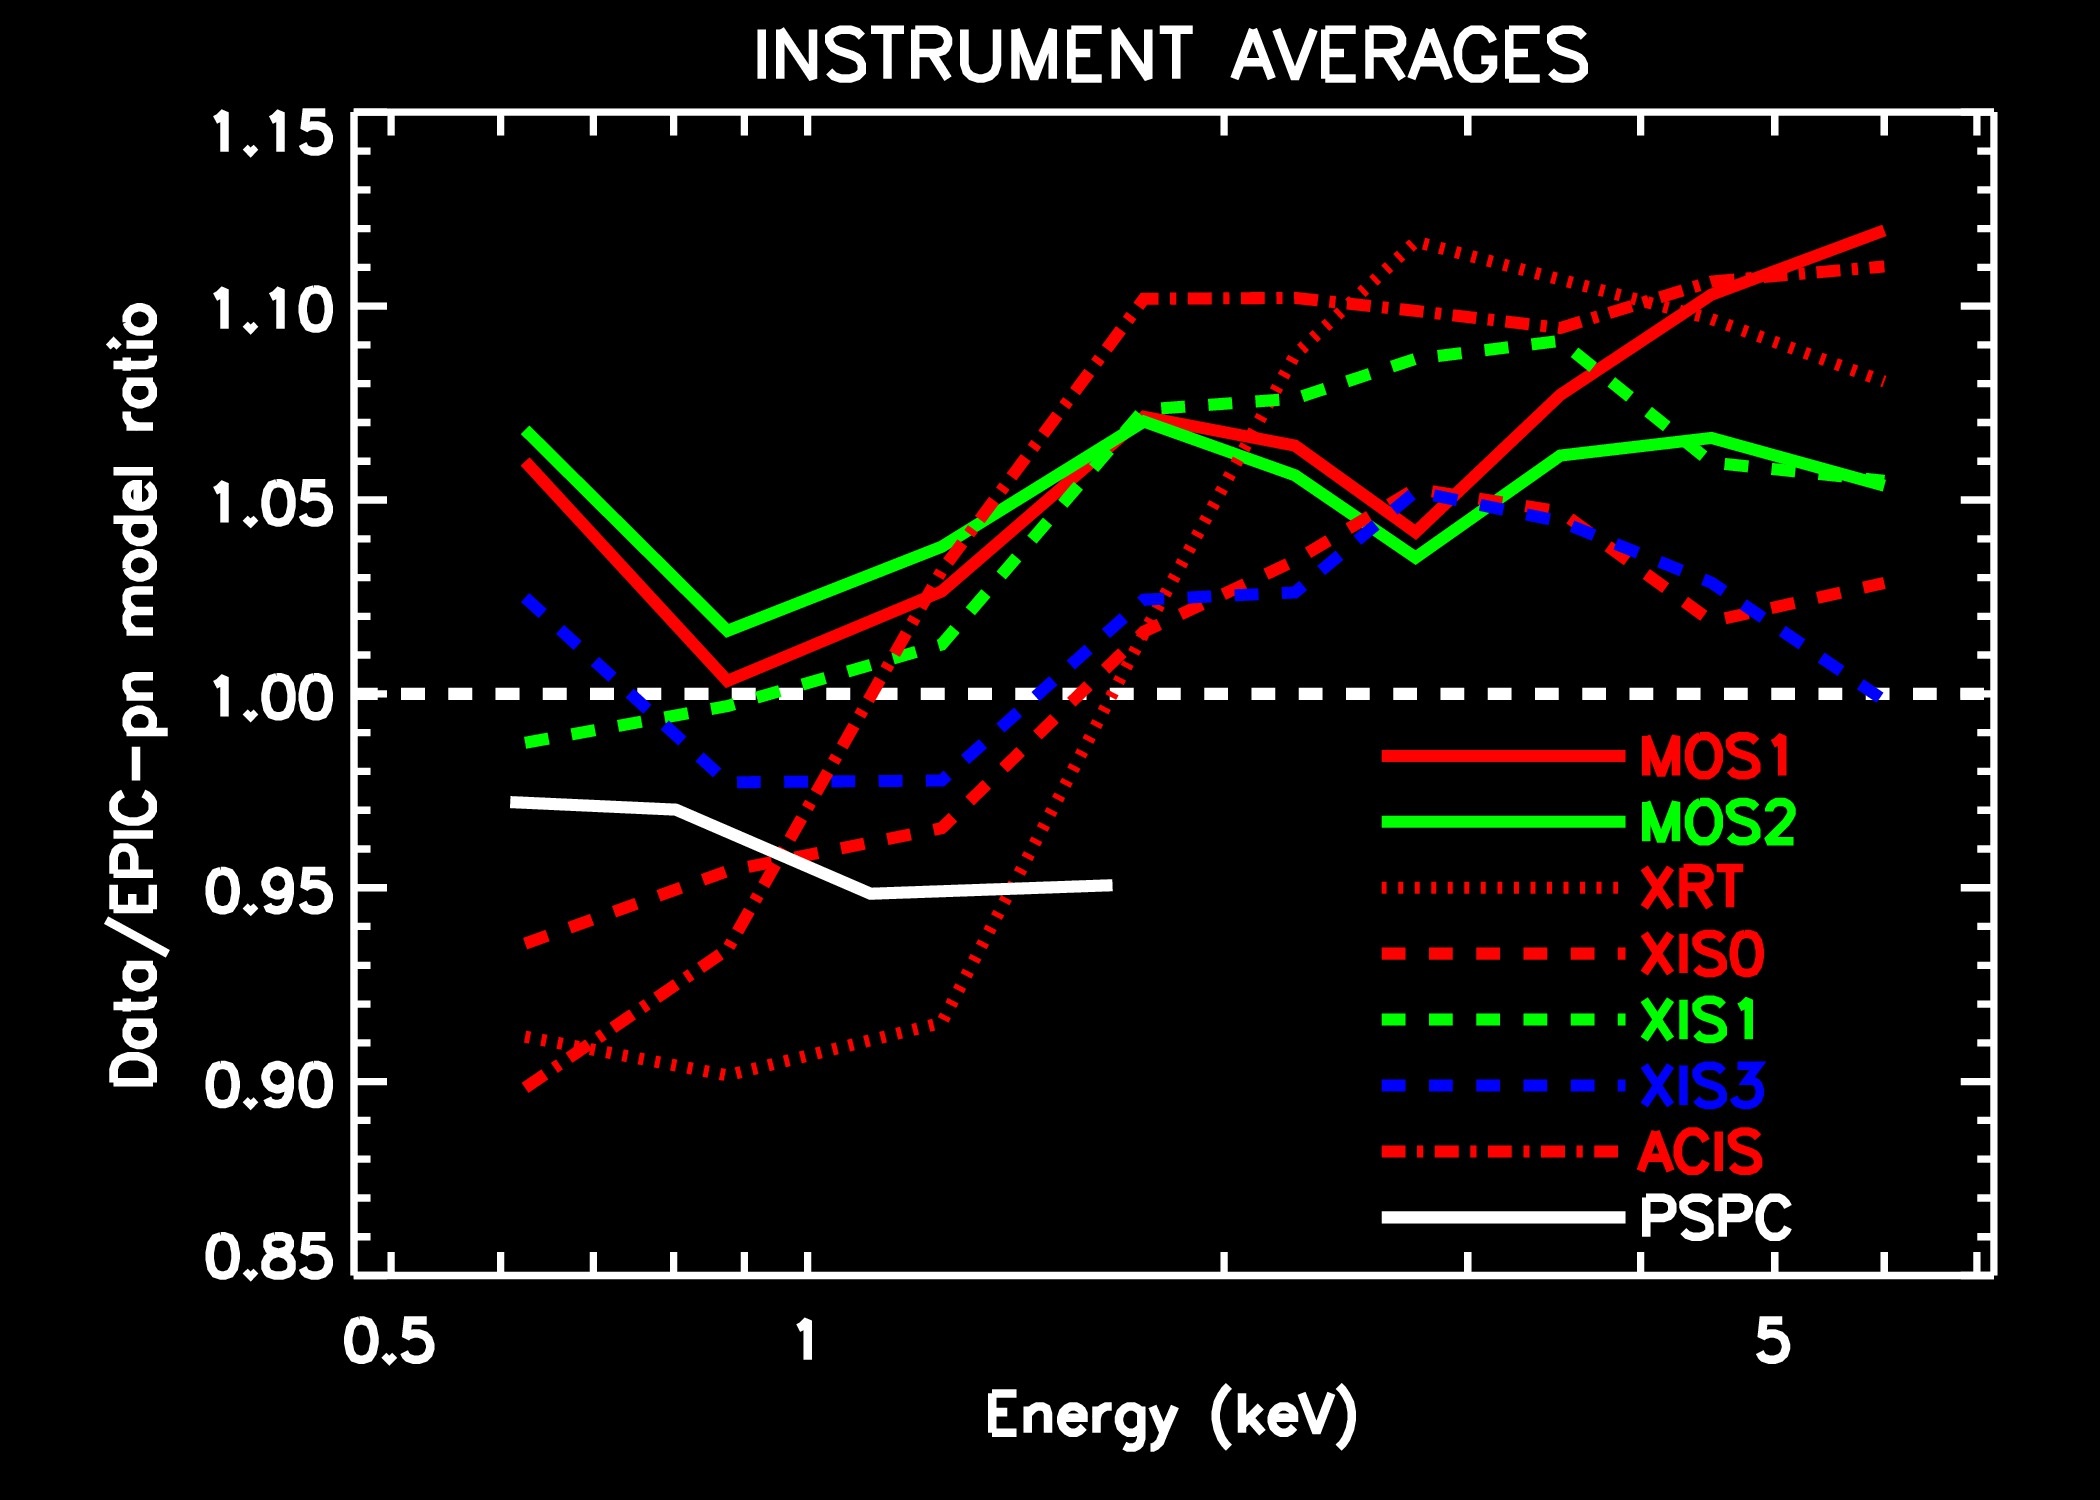
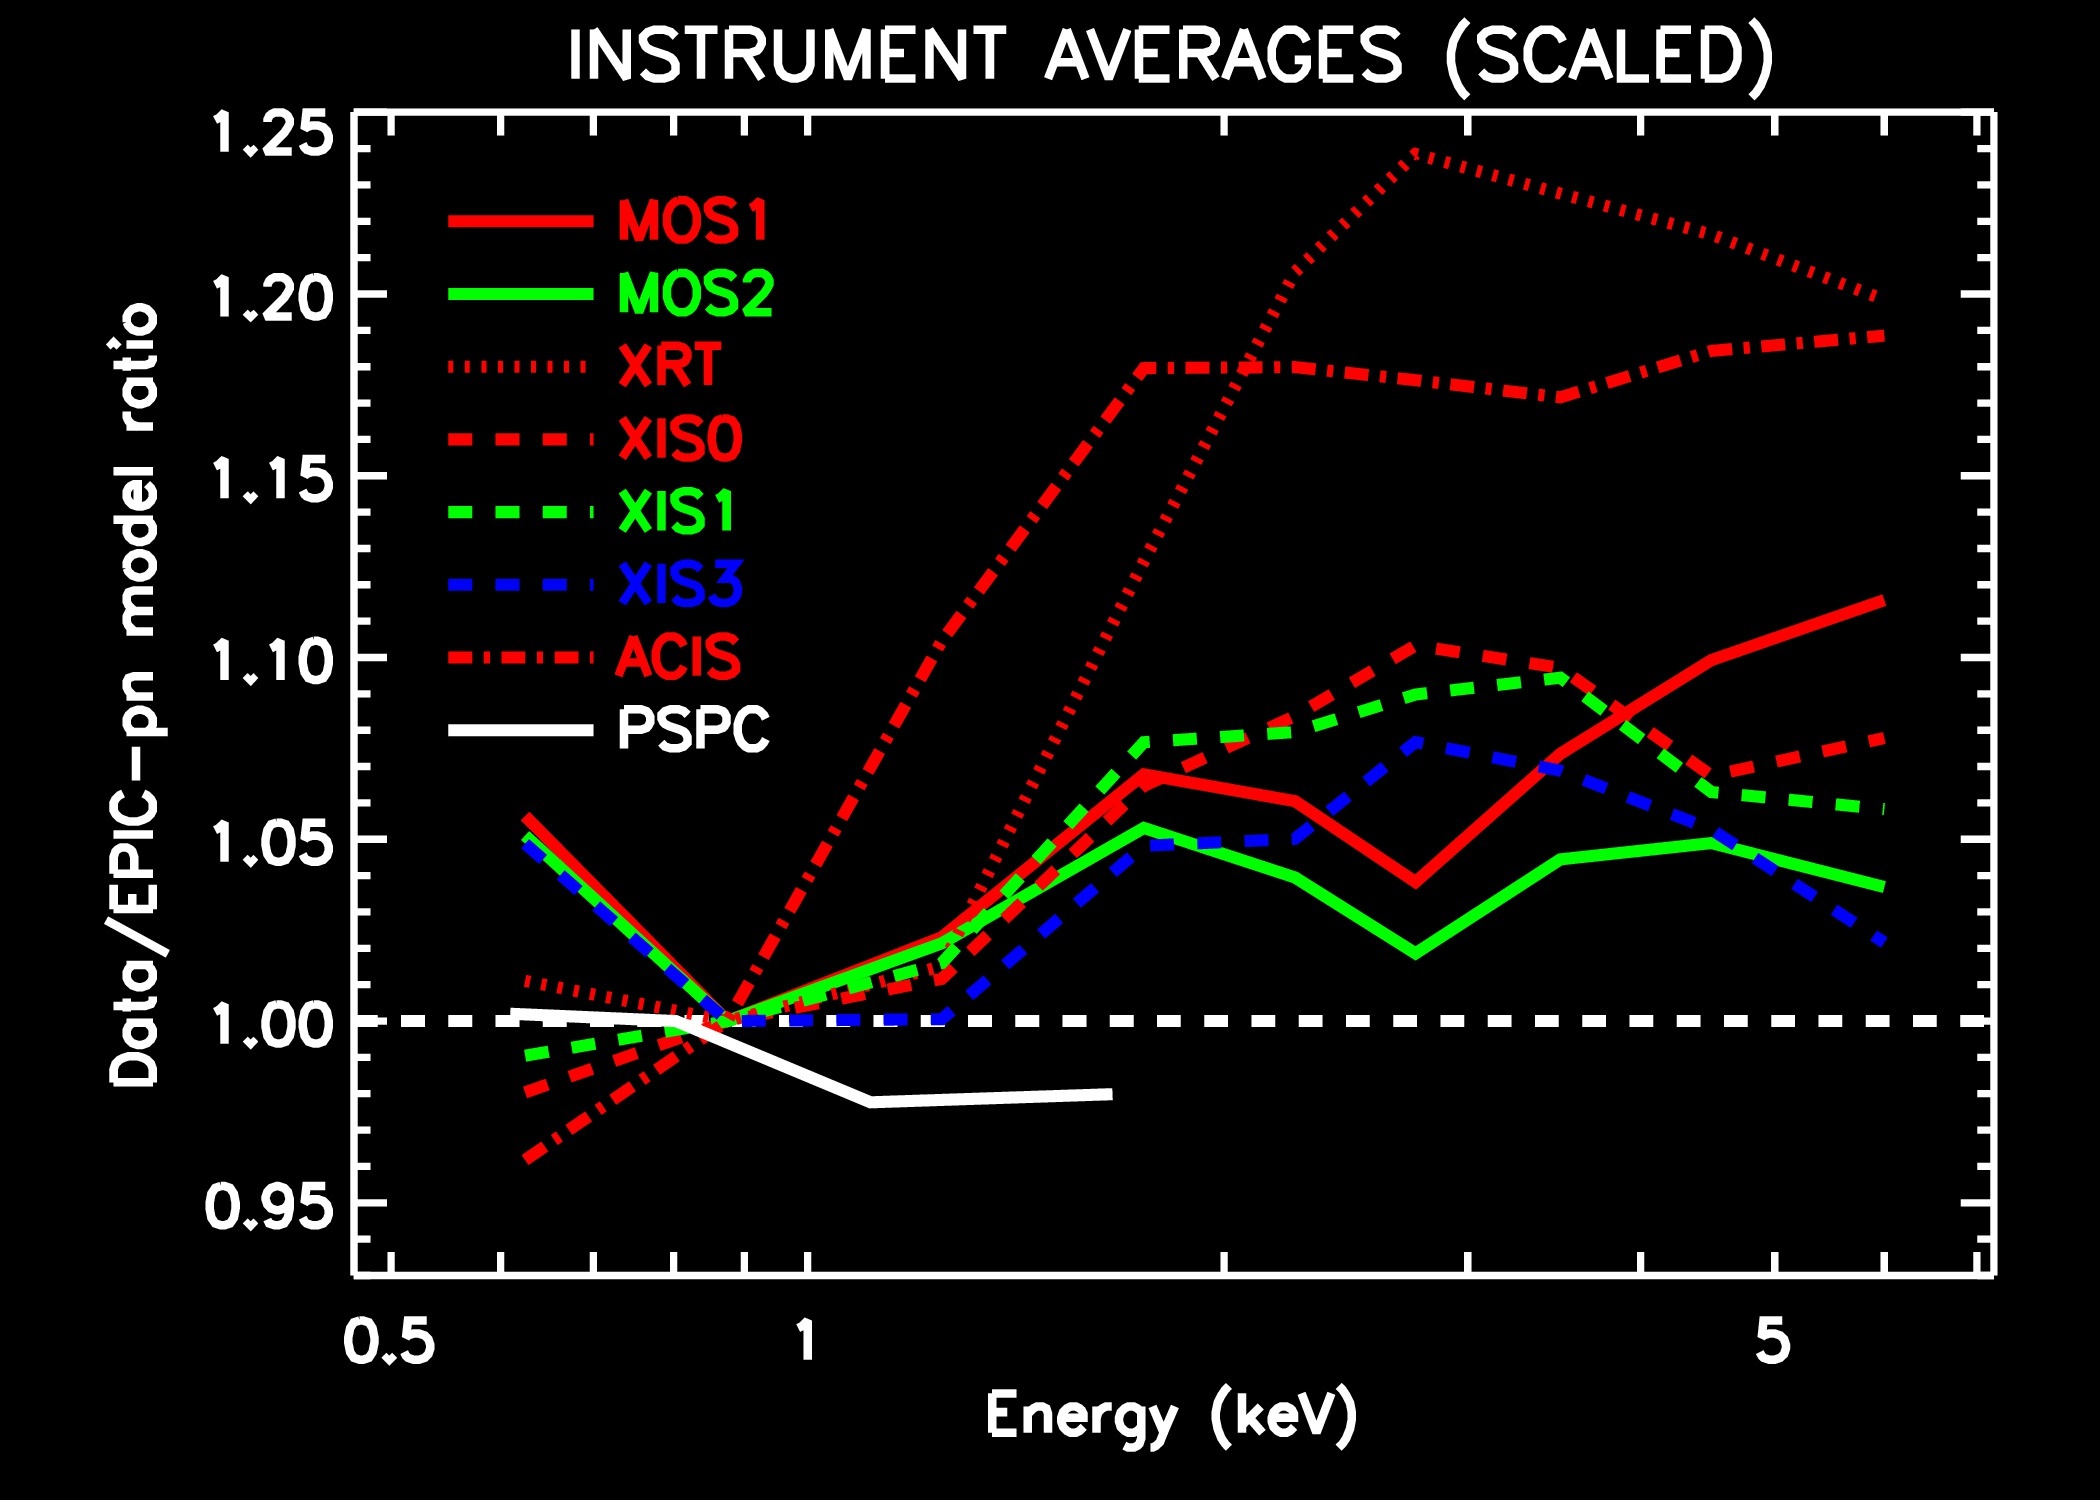
Average residual ratios of the four clusters analysed so far (A1795, A2029, PKS 0745-19 and Coma.
In the right panel the ratios are further scaled to unity at 0.75-1.0 keV. Each line corresponds to one instrument per EPIC-pn.
- Jukka's talk in IACHEC 2017 meeting
- Jukka's talk in IACHEC 2016 meeting
- Jukka's talk in IACHEC 2015 meeting
- Jukka's talk in IACHEC 2014 meeting
- Jukka's talk in IACHEC 2013 meeting

