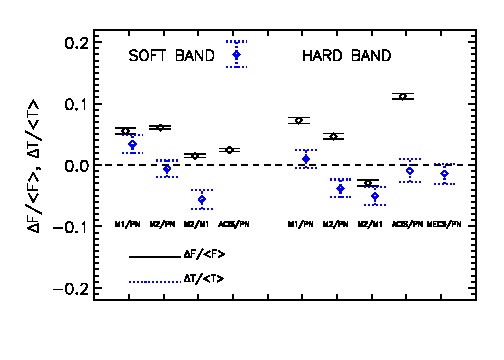
The tar files contain spectra, responses and background files necessary to reproduce the spectral analysis in Nevalainen et al., 2010, A&A, 523, 22, which yielded results summarised in
Fig.1: The average relative difference (diamonds) +- the error of the mean of the fluxes (solid line) and temperatures (dotted line) for different instrument pairs in the soft band (left side of the plot) and in the hard band (right side of the plot)
SASv9.0 was used for processing the XMM-Newton data with calibration information from December 2009.
...