...
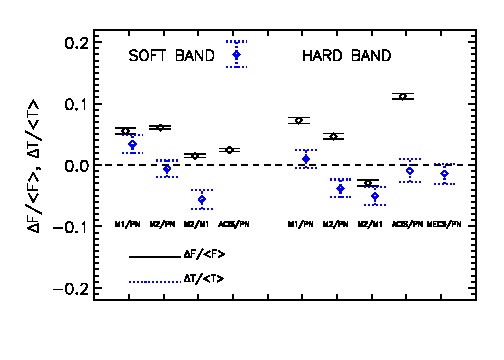
Fig.1: The average relative difference (diamonds) +- the error of the mean of the fluxes (solid line) and temperatures (dotted line) for different instrument pairs in the soft band (left side of the plot) and in the hard band (right side of the plot)
//
//
SASv9.0 was used for processing the XMM-Newton data with calibration information from December 2009.
...