...
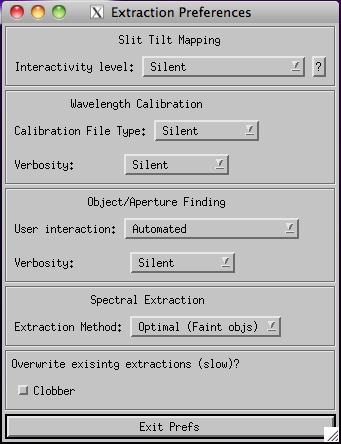
This will bring up a separate preferences panel that looks like the following:
During extraction, you will see plots of the object profile appear to indicate data quality. The plots show a cross section of the object profile with errors, and the resultant fit. As the iterative model fit and local sky subtraction improve, you should see the residuals in this plot diminish, through each iteration on a given order.
...