...
In Figure 2 we show a screen capture of what the student would see on her computer screen when doing the experiment on line. The left of the screen shows the LabView interface that controls the experiment remotely, with a display of the data returned from the experiment. In the visualization panel to the right, the real-time position of magnet is used to control the position of the "virtual" magnet in the visualization. We augment this representation with the magnetic field lines of the magnet and of the current-carrying coils, computed in real-time using the position of the magnet and current in the coil. The shape of these field lines shows the effects of the pressures and tensions transmitted by the magnetic fields from the coils to the magnet, as illustrated below in passive "movie" visualizations (see Figure 3).
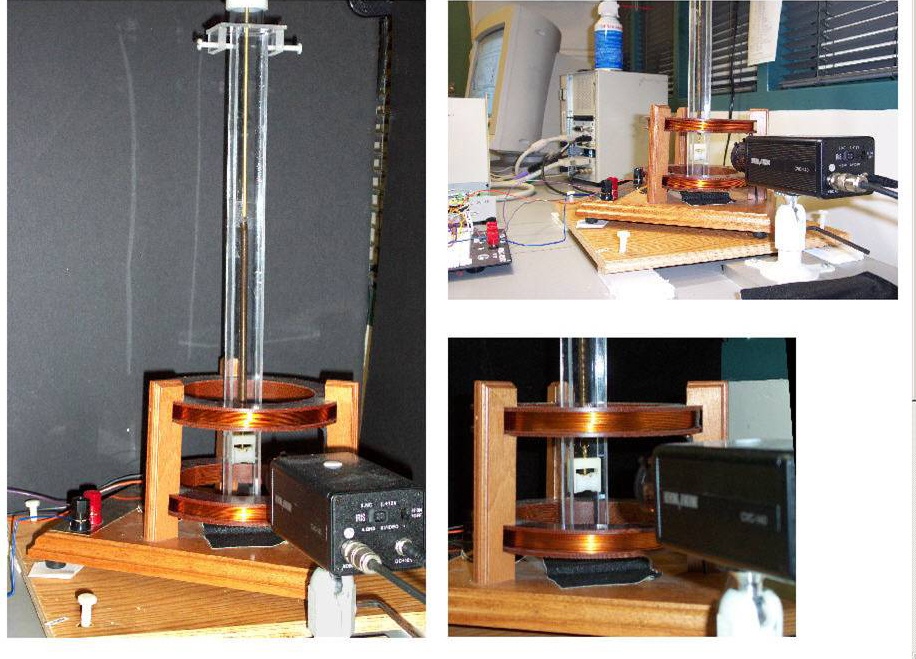
Figure 1: The TeachSpin Magnetic Force Experiment from two angles.
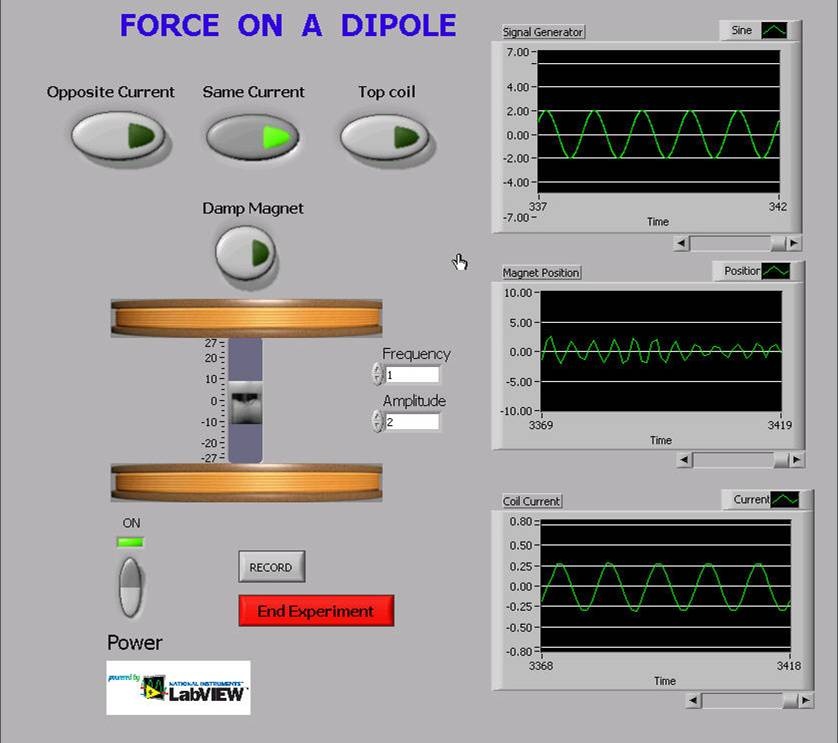
Figure 2: The LabView interface for controlling the experiment.
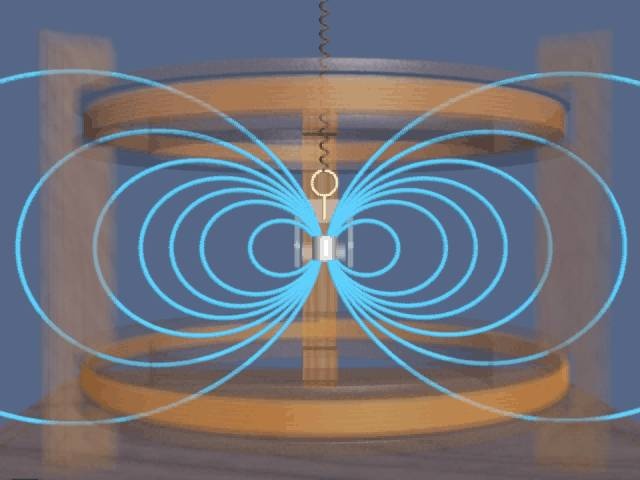
Figure 3: The (left panel), and the visualization of the experiment driven by the data stream (right panel) .
If one views the animations referenced in the Figure 3 caption below4, one can get an intuitive feel for why in one case (gradient in the magnetic field of the coils) there is a force on the dipole and why in the other case (homogeneous magnetic field of the coils) there is not. This will be more immediate in the real-time virtual experiment driven by the data from the on line experiment. In particular, the student will be able to switch from one configuration to the other, and see the immediate response in the motion of the magnet, reflecting the immediate change in the configuration of the magnet fields. Although the passive animations we have linked to below are much more elegant than the real-time visualization, the real-time visualization will be reasonably attractive (see Figure 2), and has the great advantage that the student can interact with it by changing the experiment parameters.

Figure 34: Passive visualizations illustrating what the real-time visualization of Figure 2 would look like if the currents in the coils are oppositely directed (force on the dipole) or in the same direction (no force on the dipole).
...