Observation List
NuSTAR has observed N132D twice
| OBDSID | Date | Exposure Time Mode 01 / 06 | Notes |
|---|---|---|---|
40101010002 | 2015-12-10T05:00:59 | 64-ks / 39-ks | |
10601407002 | 2020-03-13T10:46:49 | 82-ks / 25-ks |
Notes on Mode 01 vs 06
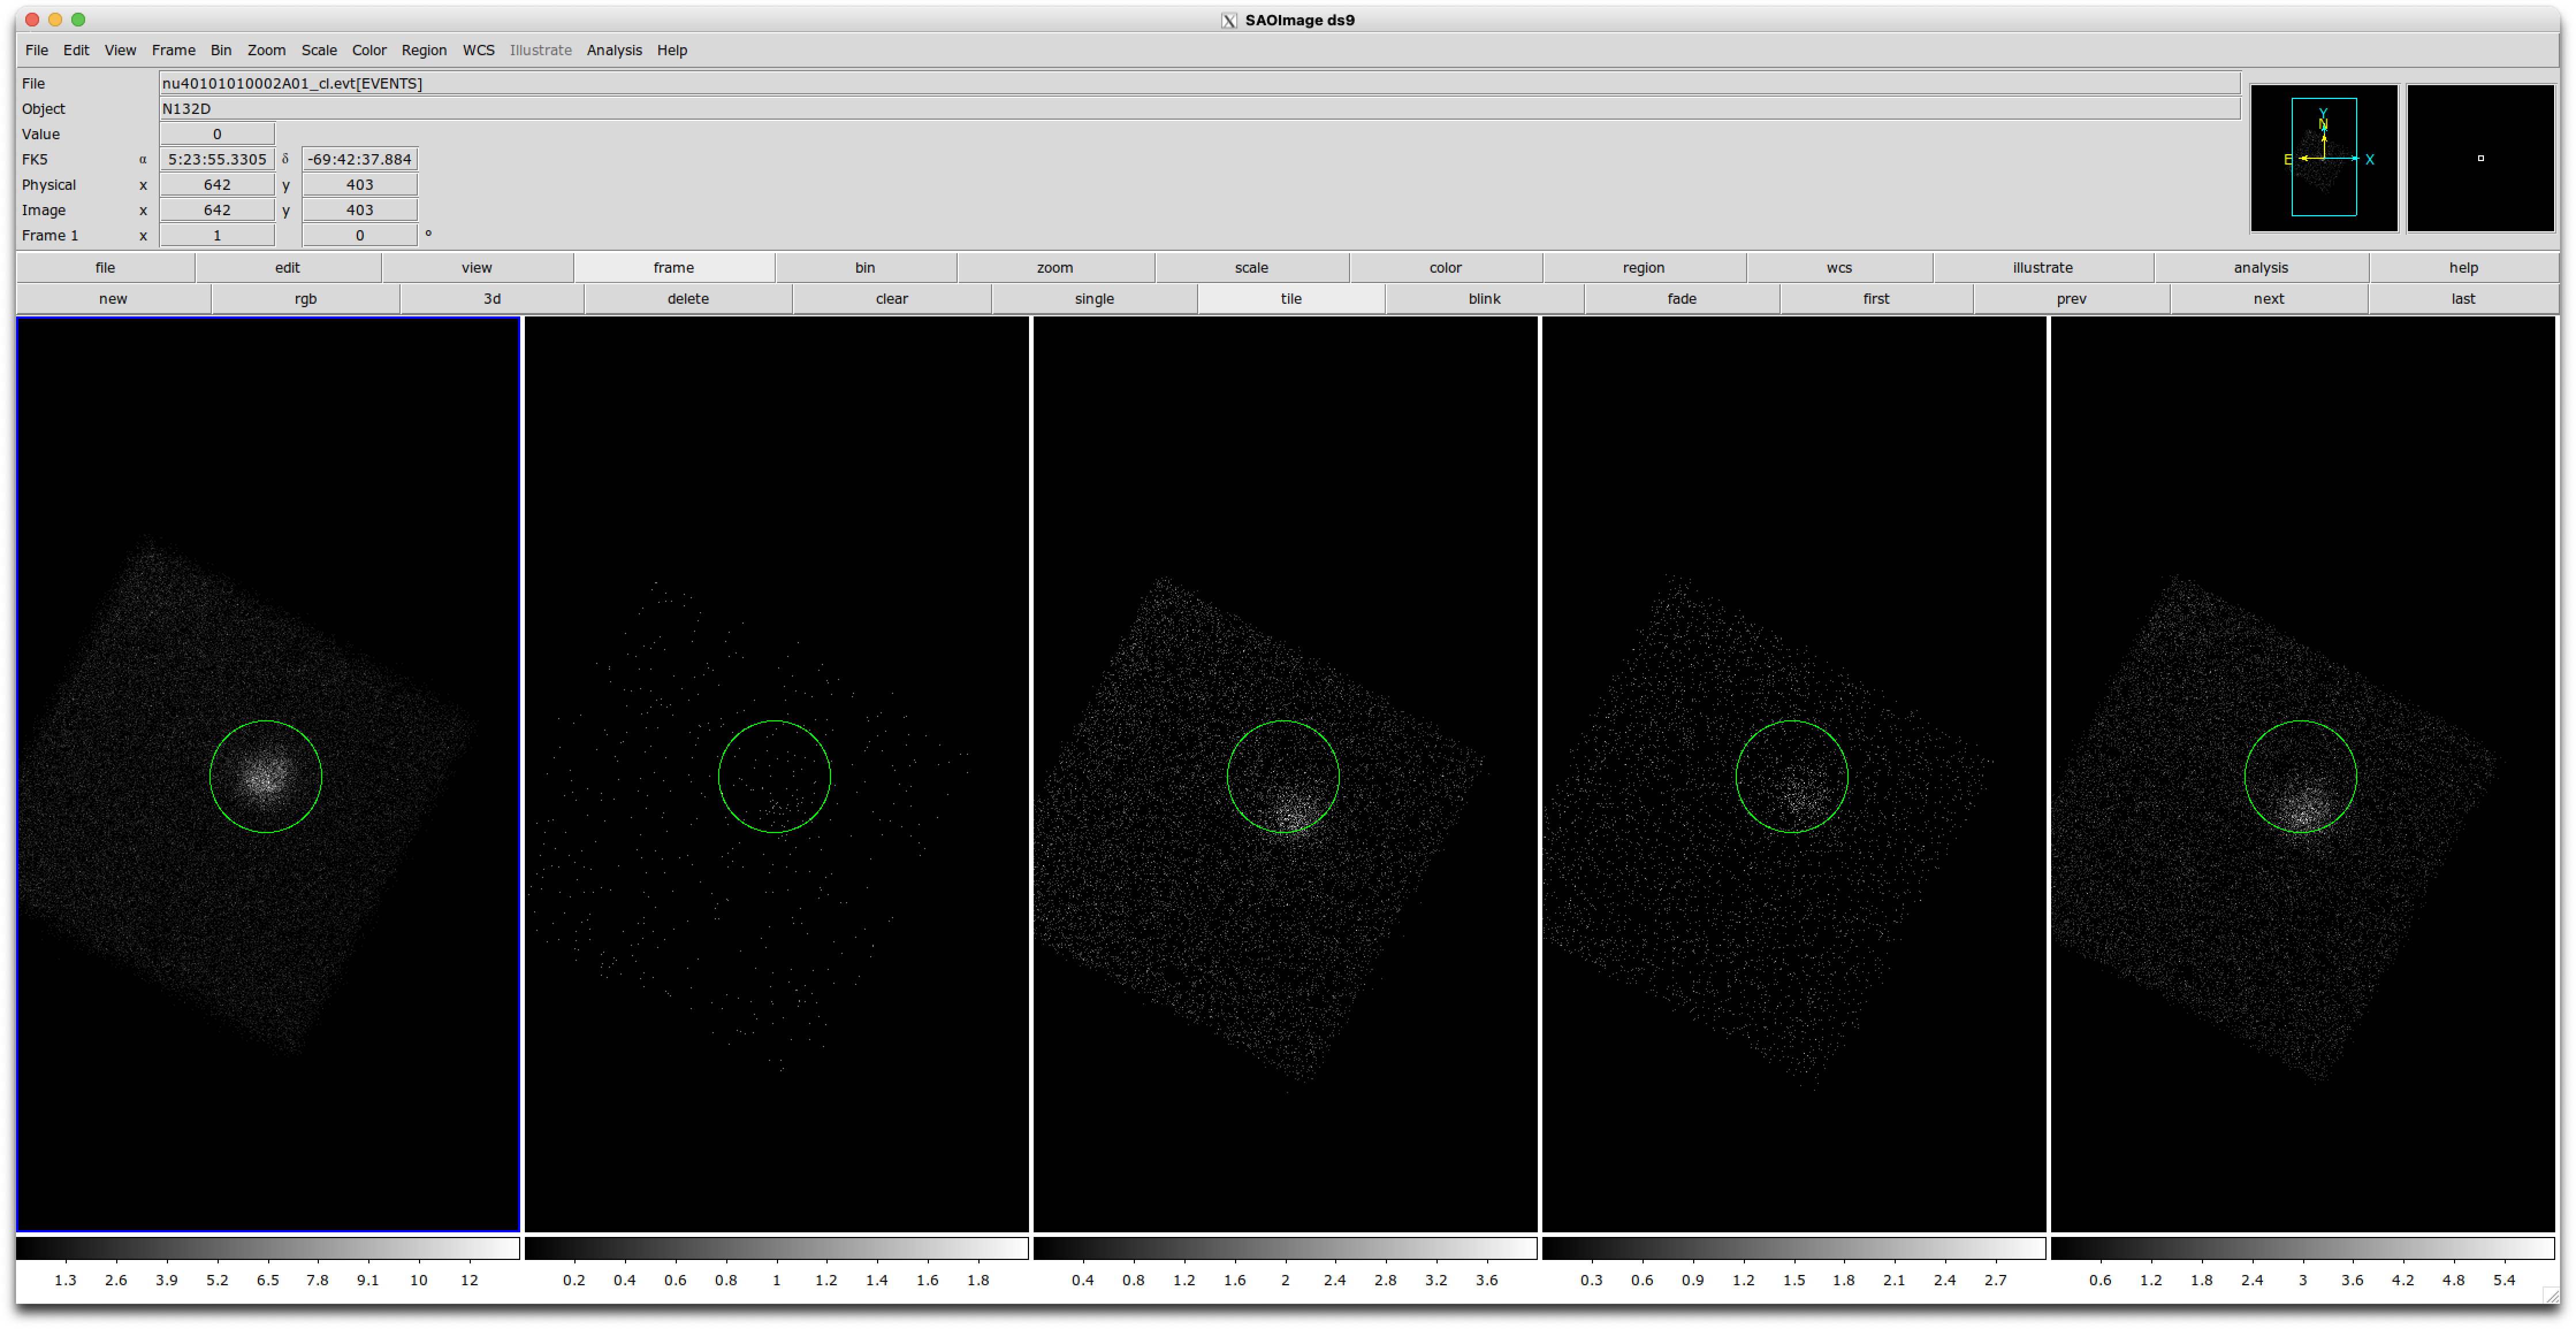
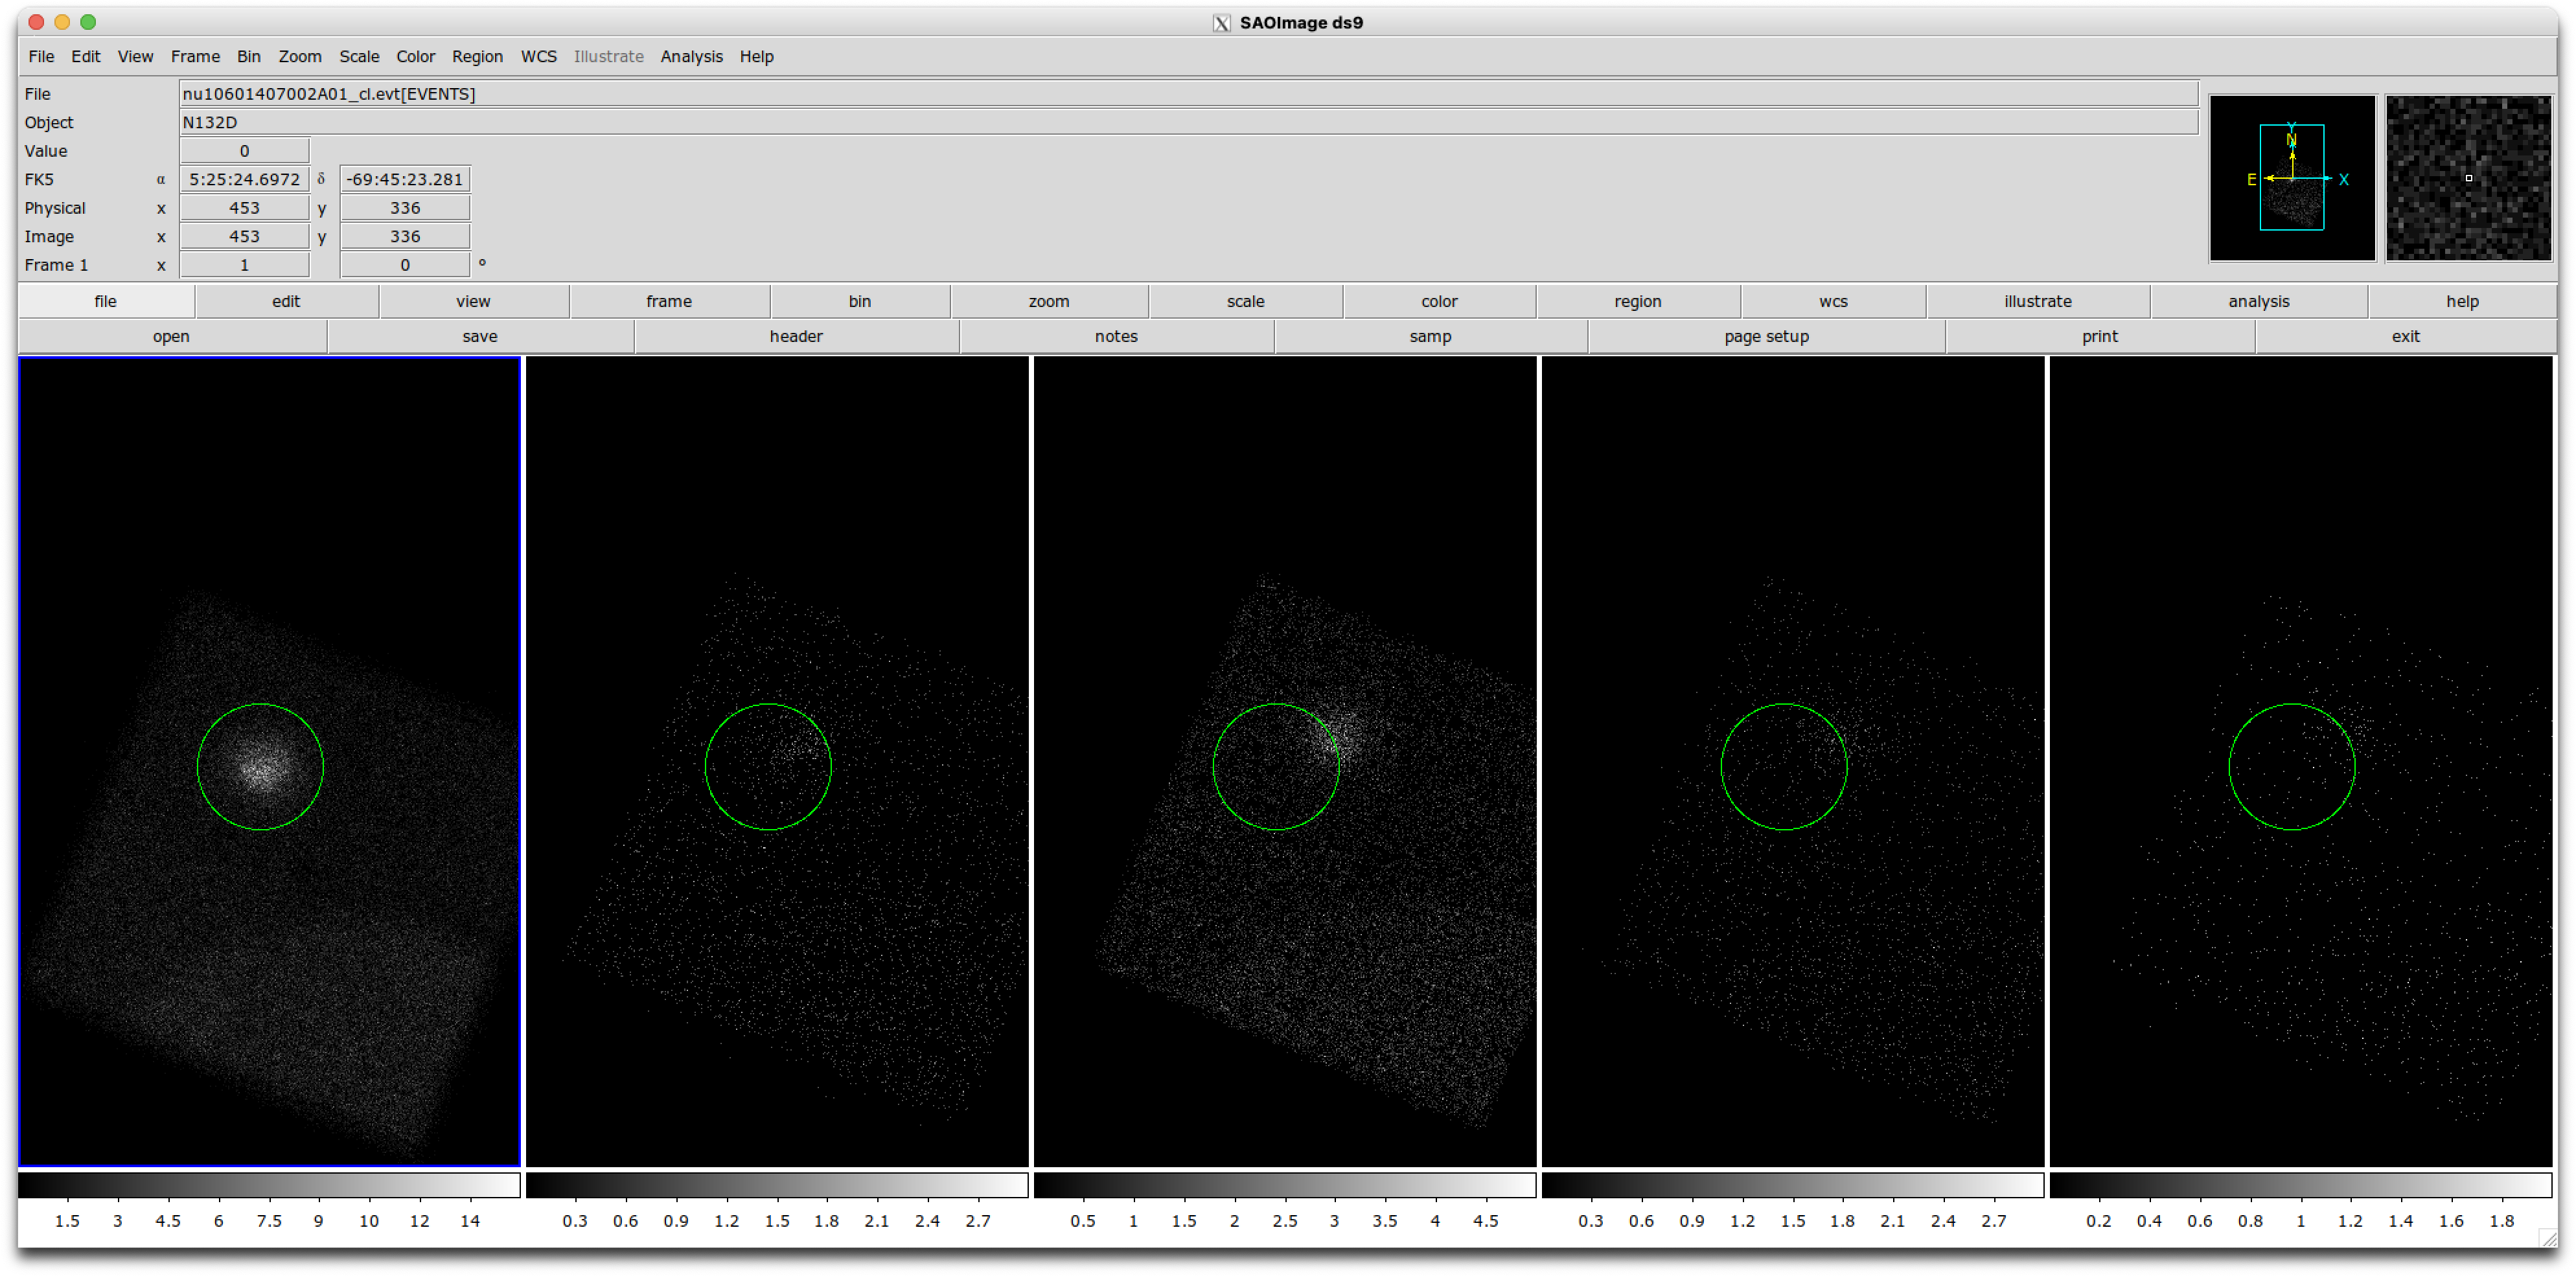
Mode 06 are "good" science where the orbit of NuSTAR brings the Earth into the FoV of the co-aligned star tracker. This removes a key
element of the overall astrometric corrections. For example, here is the sky projection from 2015 showing the 01 data (left) with a
120-arcsec region and the same region shown on the sky projection of Mode 06 (subsequent columns) showing the offset by roughly
~1-arcmin between the two cases. The offset can vary based on which combination of S/C starcameras are driving the S/C ACS system.
In this case, it looks like the two main combinations (combination of 2+3 and 3-only, columns third from left and far right) have roughly
the same pointing. In general, re-centering the exraction region per pointing allows simultaneous fitting of the 01 and 06 data downstream.
This has been explored in the late 2020s using N132D, but for now we'll revert to using only the 01 data.
2015 Log
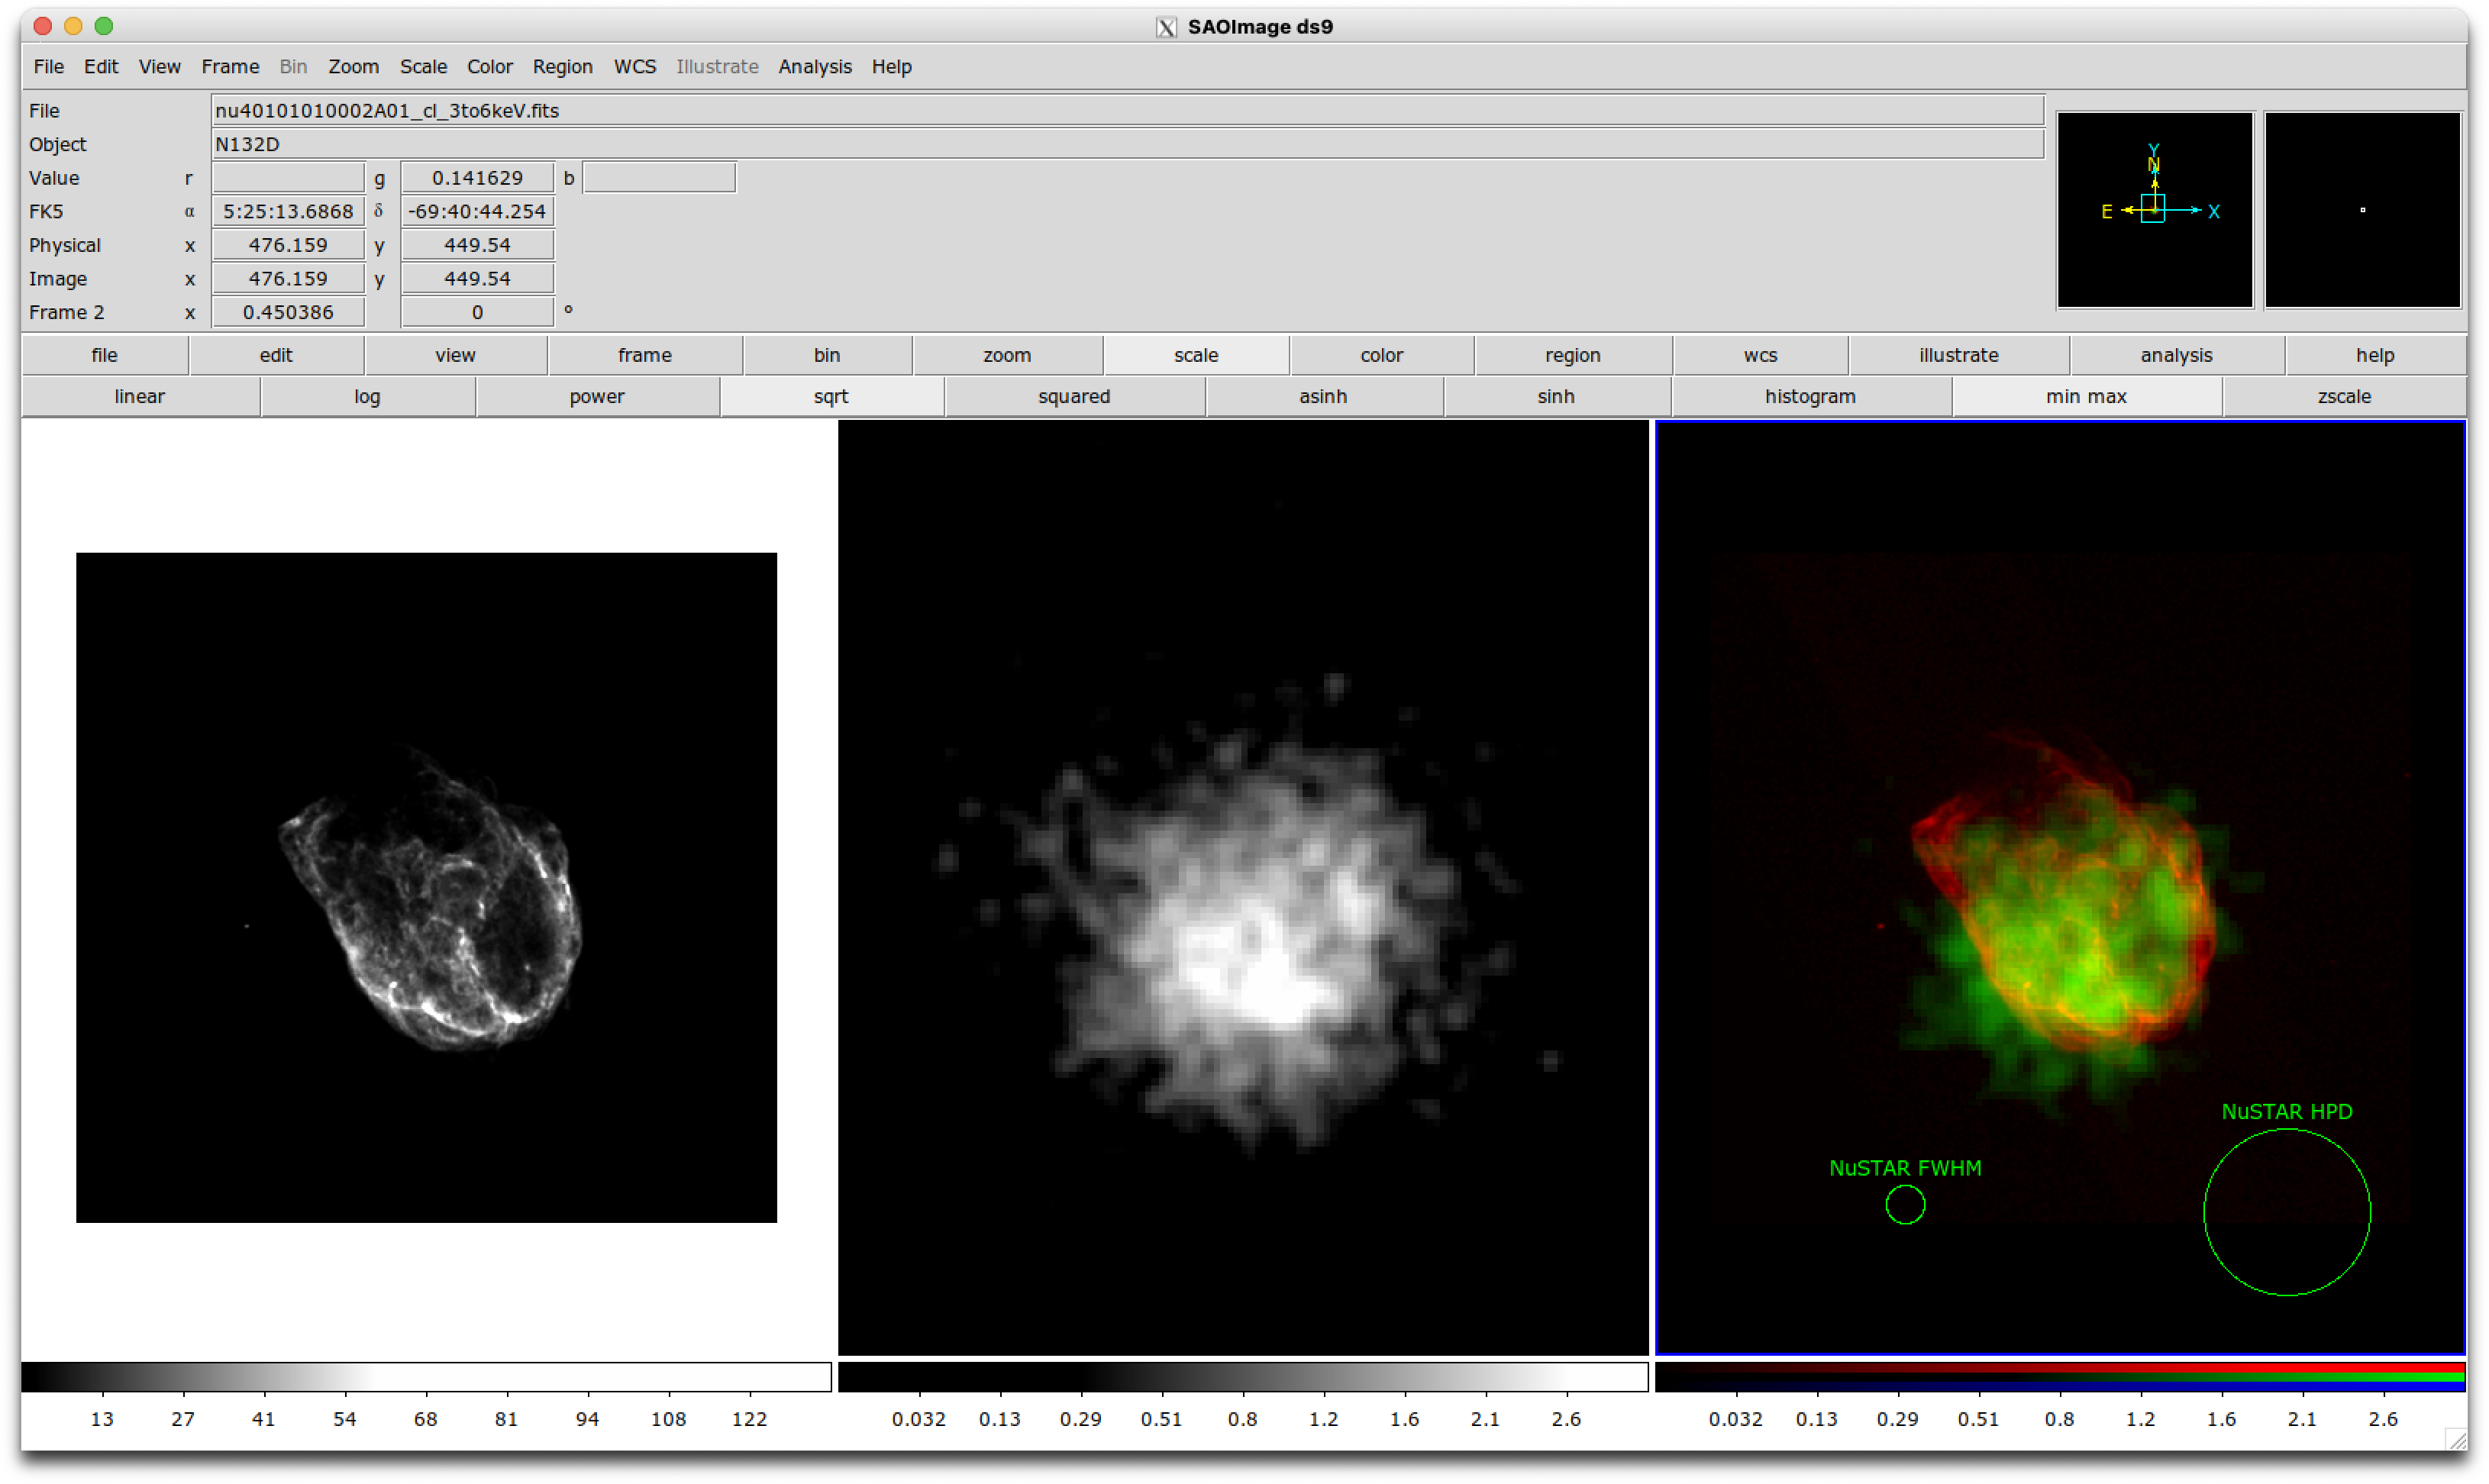
Chandra 0.75 - 7 keV (left), smoothed NuSTAR 3-6 keV (middle), Overlay (right) with roughly the size of the NuSTAR PSF FWHM (14-arcsec)
and HPD (60-arscec).
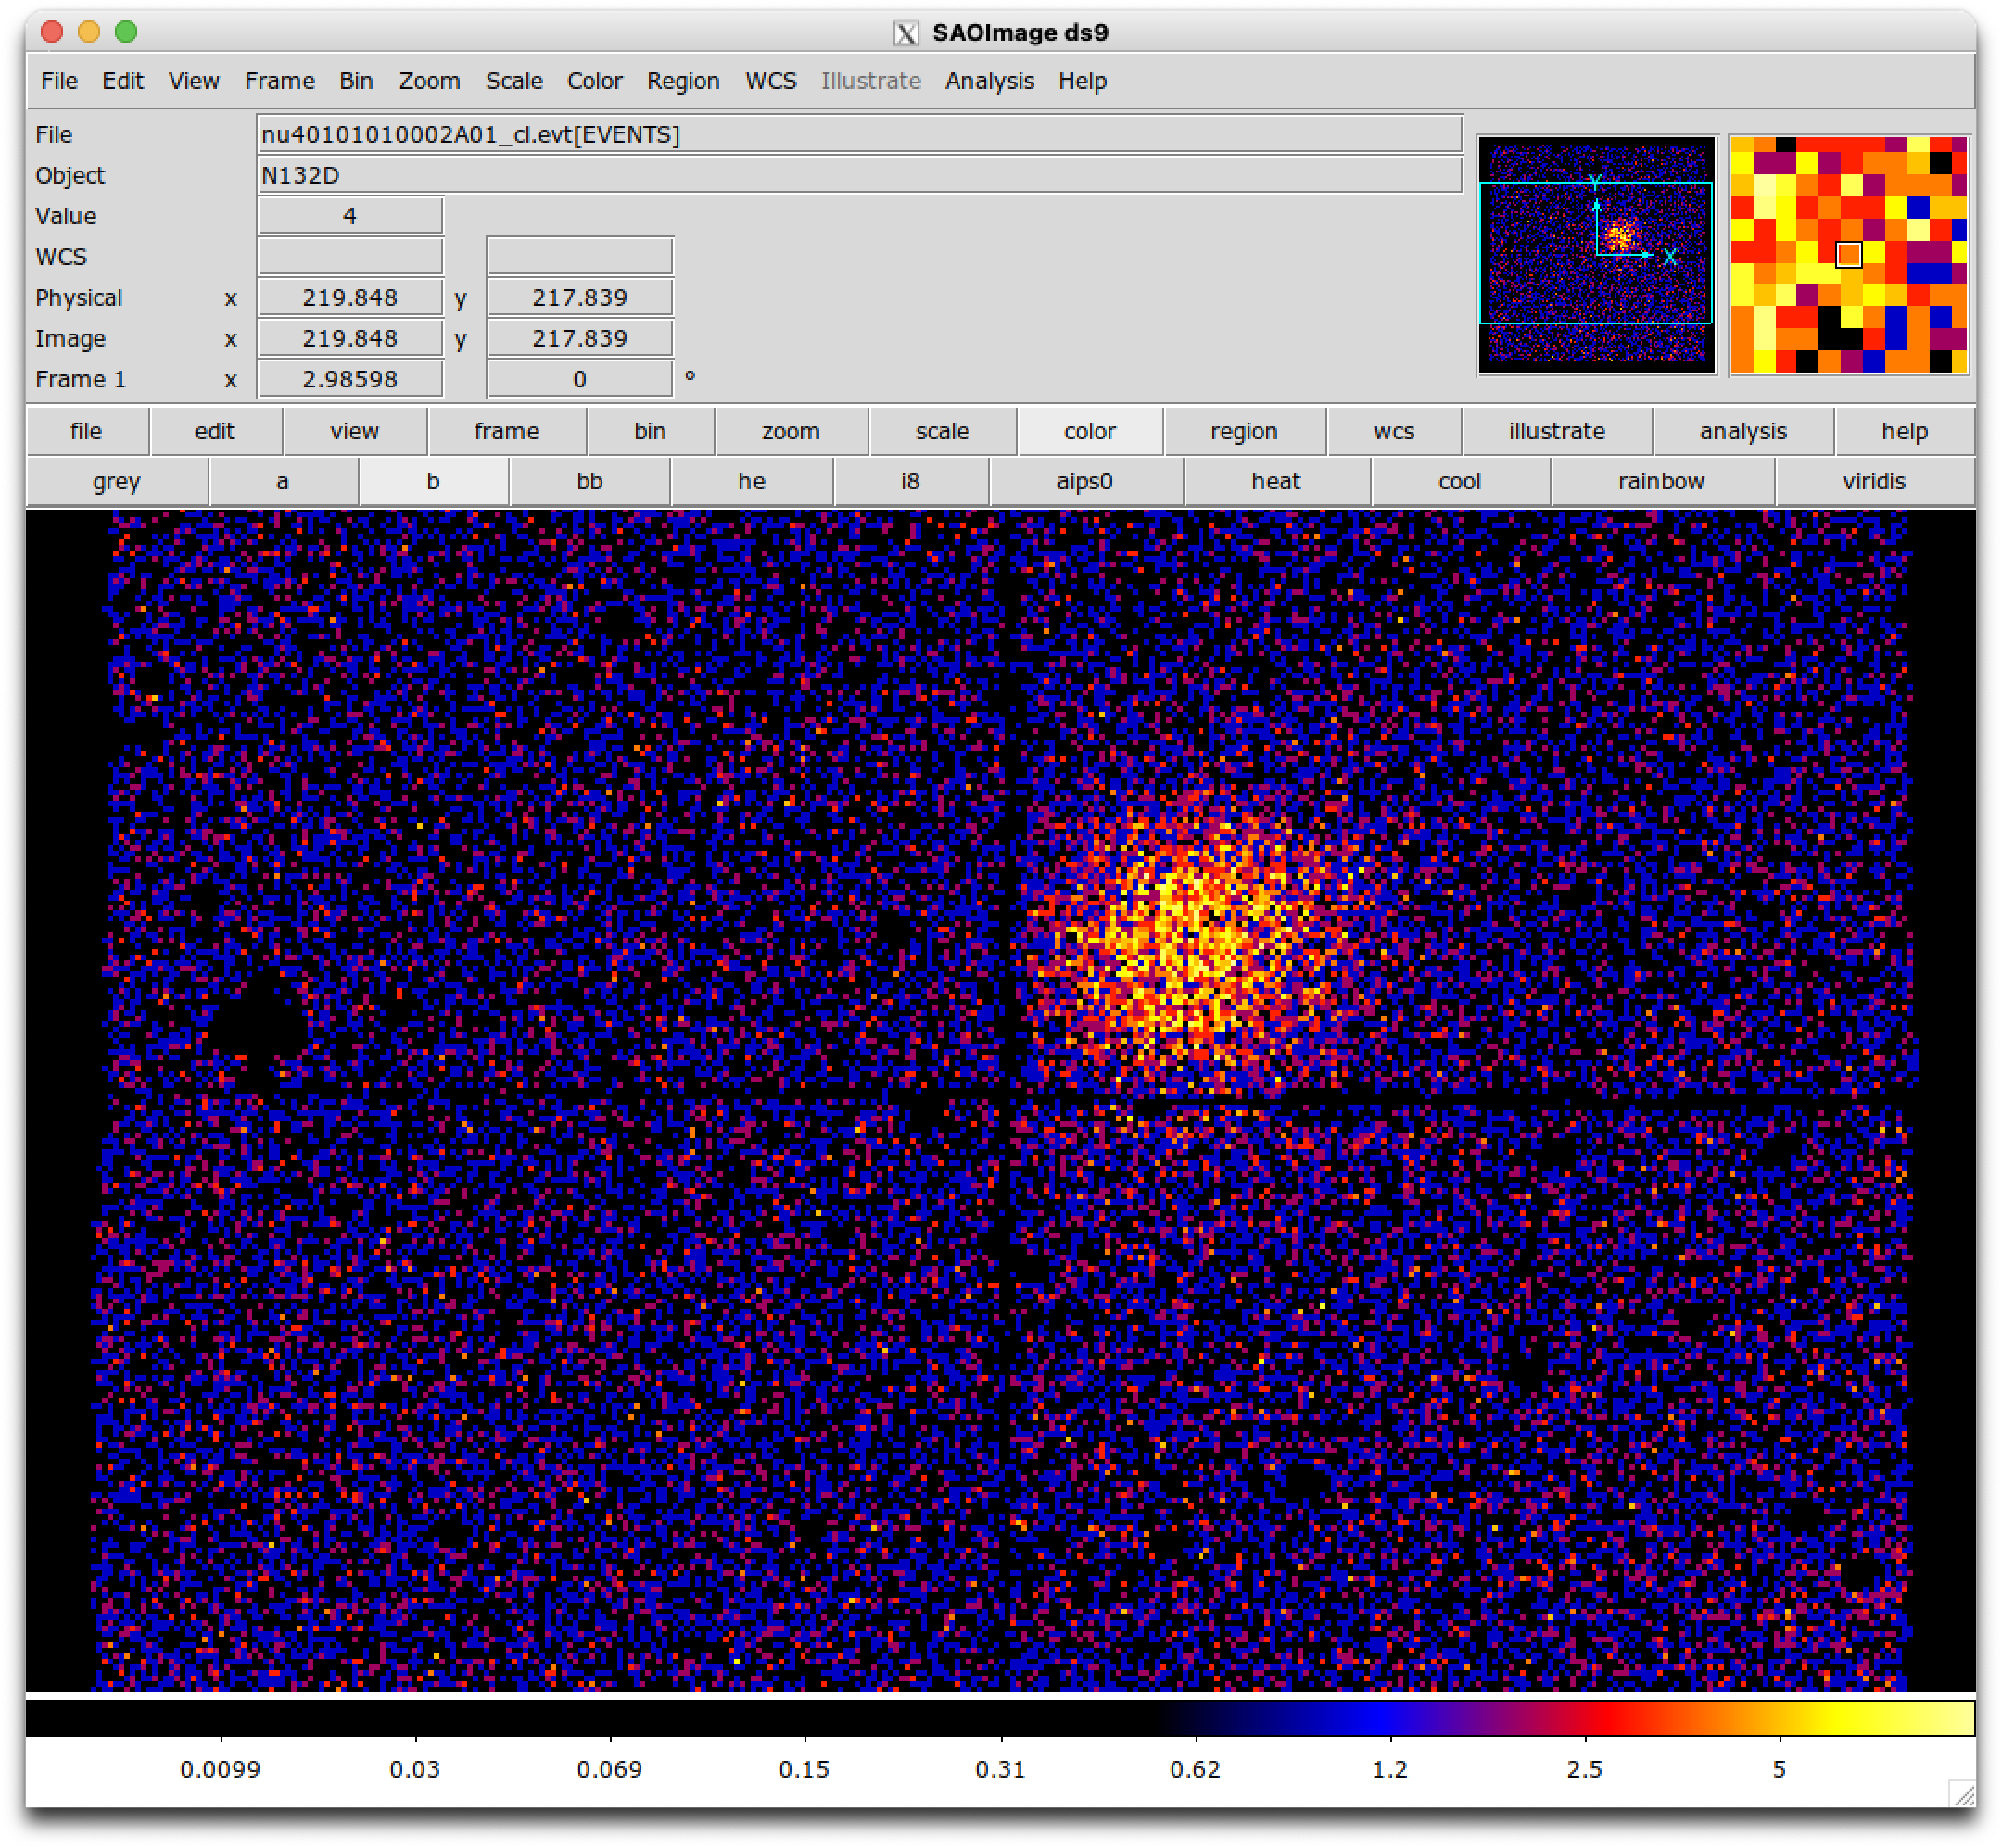
Below is N132D in "detector" coordinates. In this orientation, north is "up" and east is is "down". So there's a small loss of signal to the
northeast of the remnant into the detector gaps.
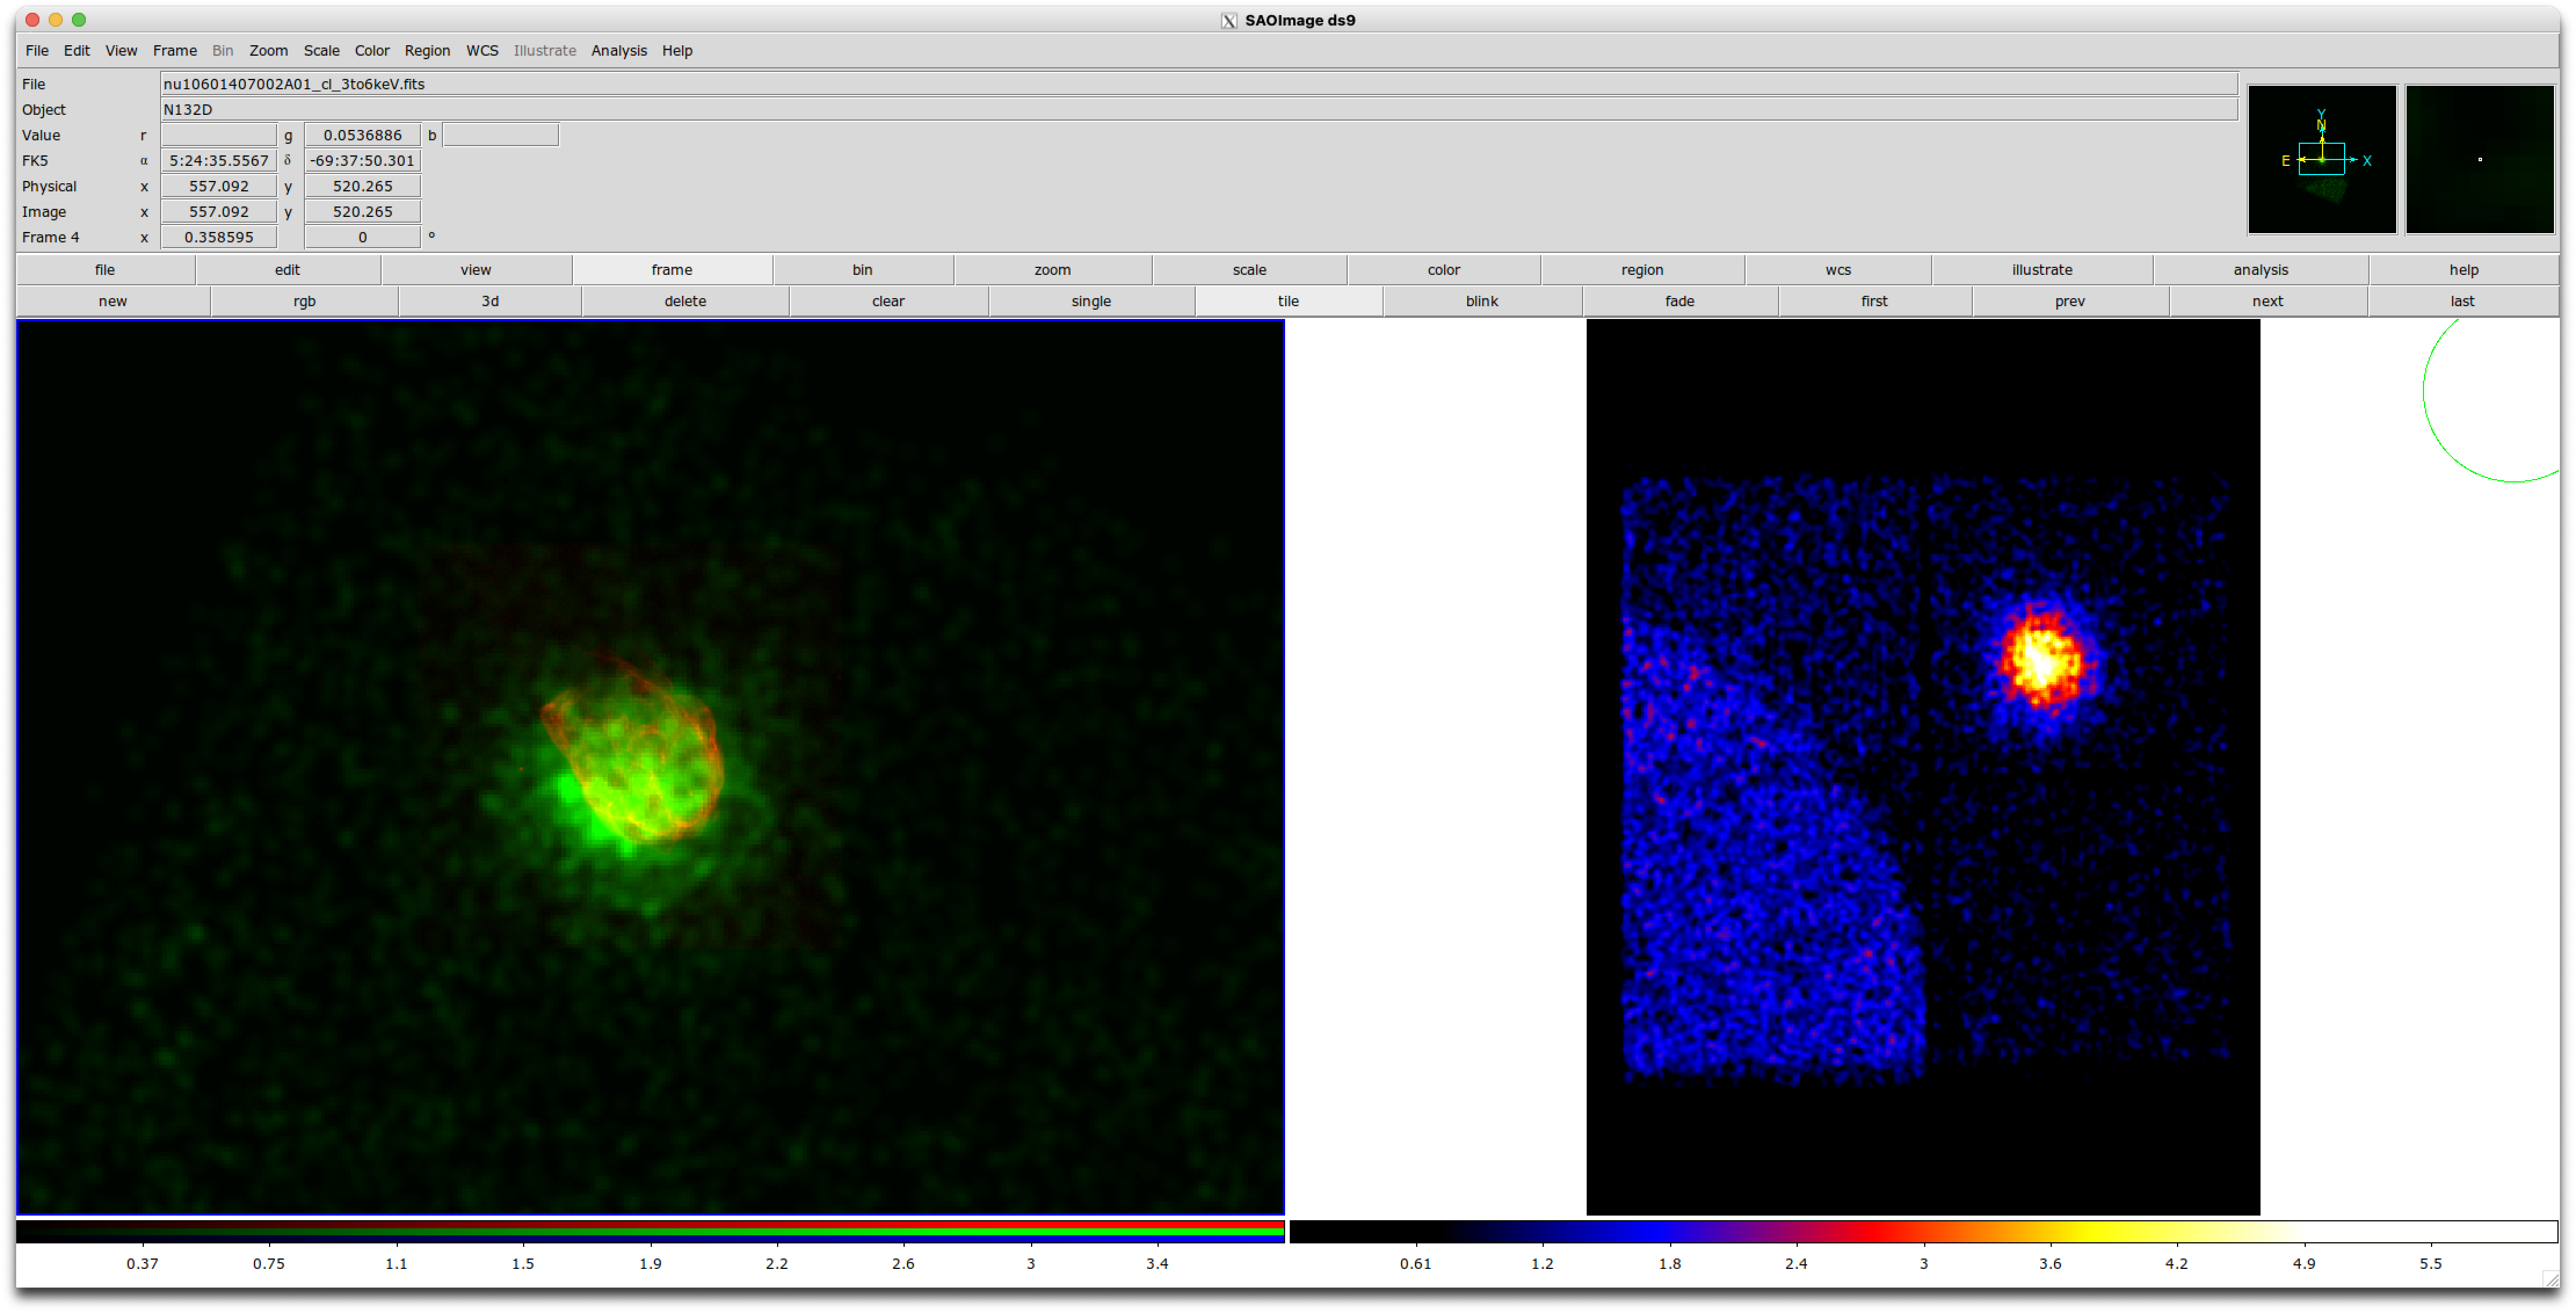
2020 Log
Same red/green overlay as in 2015 shown on the left. May by a small astrometric offset between 2015 and 2020 (standard NuSTAR
astrometric accuracy is a ~8-arcsec, so this shift is reasonable given the systematic uncertainty given there's not a point source in
the FoV that can be used to determine the absolute astrometry.
The right image gain shows the image in detector coordinates, where the aim point for this source moved it further onto DET0 to
avoid the gaps (compared with the 2015 data). The clear stray light pattern from LMC X-2 (or LMC X-4) cn be seen in the lower left.
Below, similar Mode 01 vs 06 data as above showing the different offset between 01 and 06. Again, dominated by CHU23 combination.
NuSTAR vs XRISM
Capturing a 2026 email thread between BG, Hiromasa Suziki, Paul, and Martin:
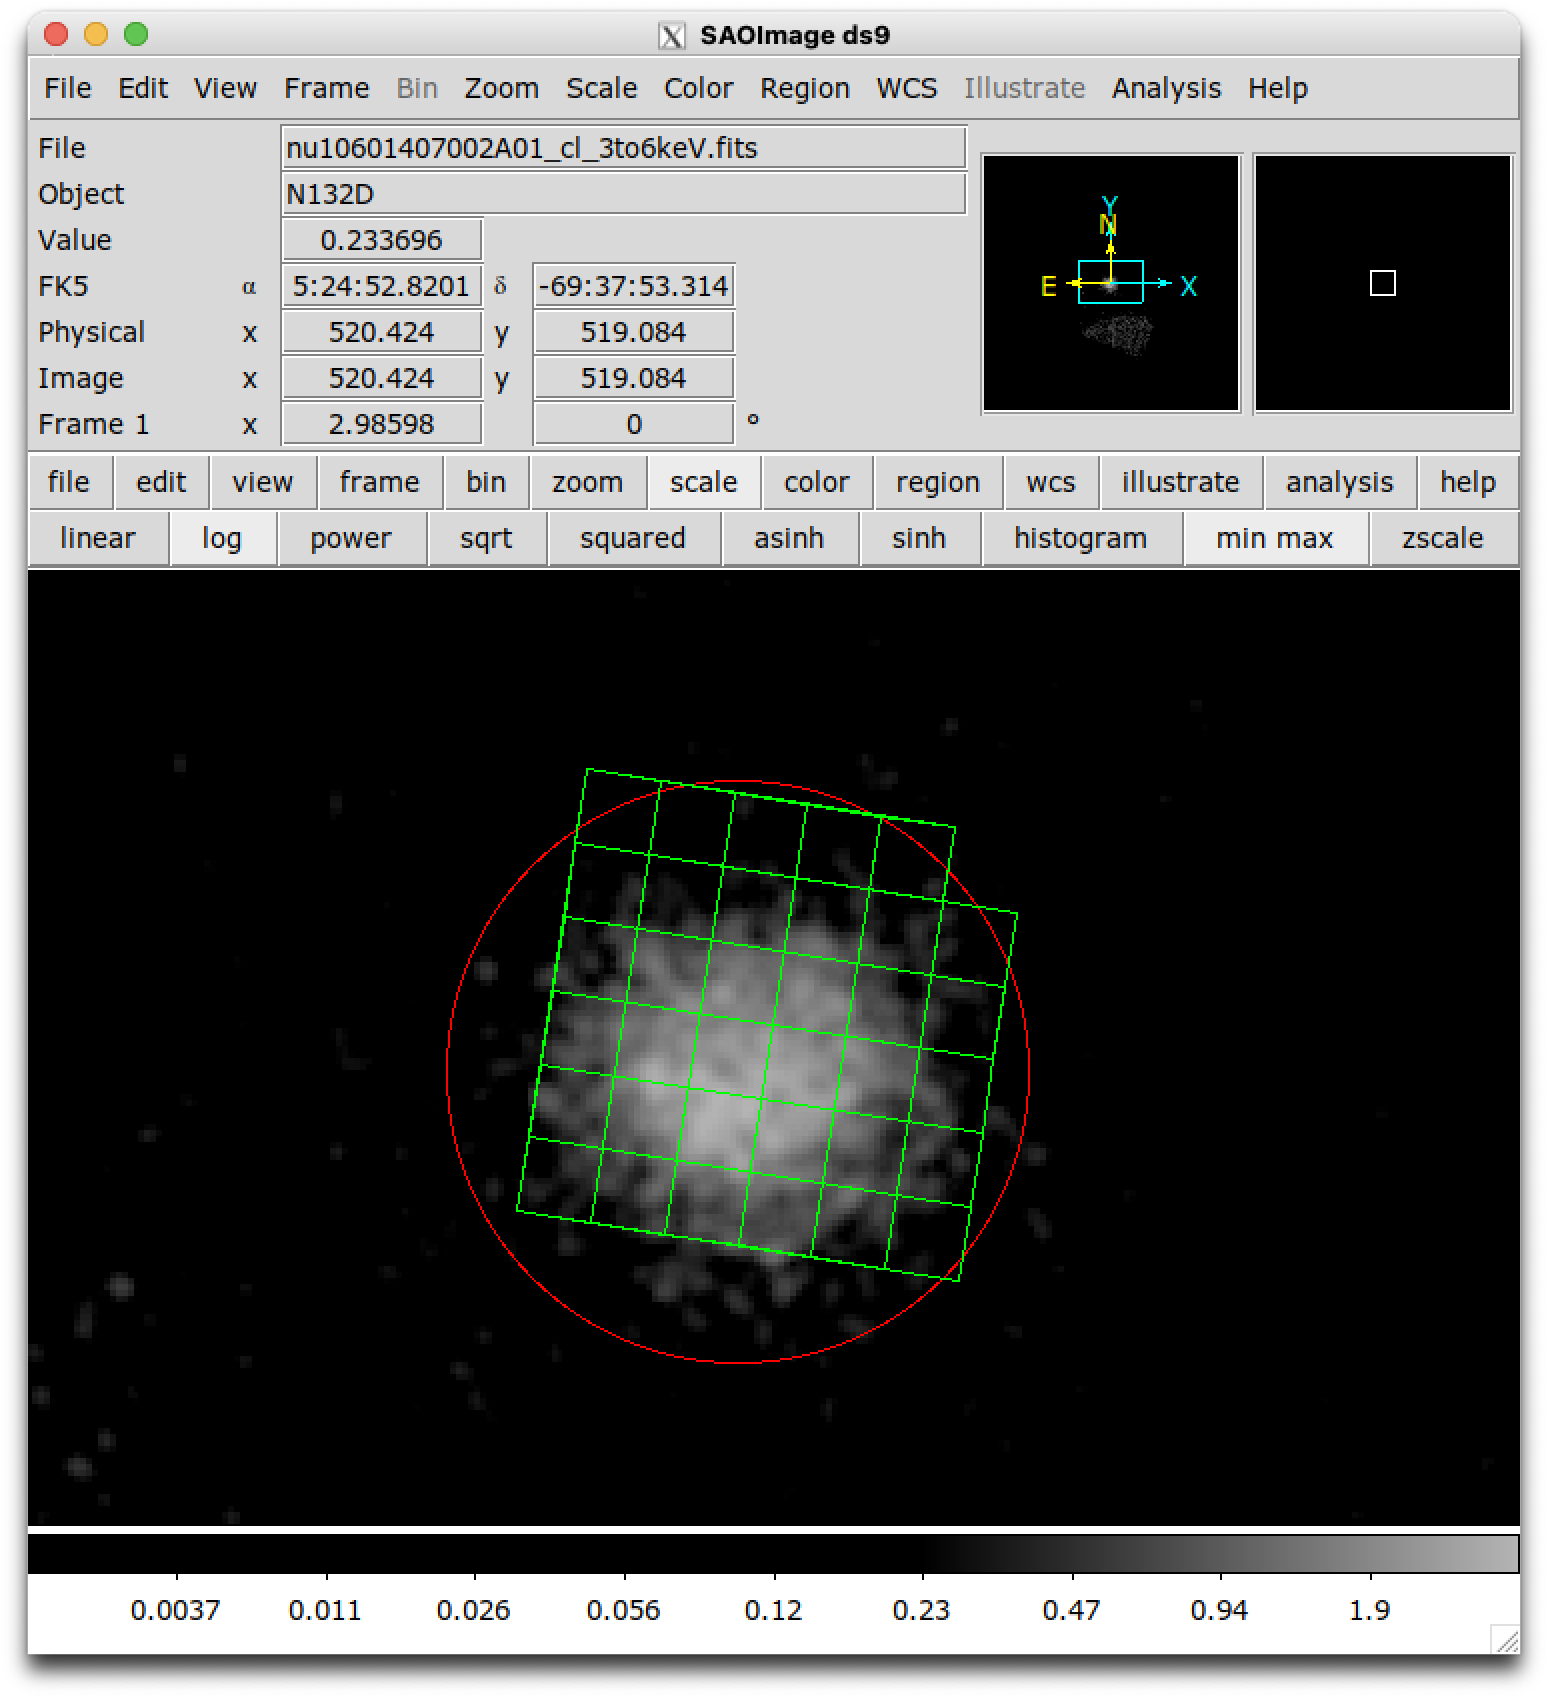
Key point: when comparing NuSTAR and XRISM, we (probably?) need to consider the loss of signal out of the XRISM field of view as a function
of position across the remnant.
Below shows the NuSTAR 3-6 keV 2020 data, the 120-arcsec radius region used for NuSTAR extraction, and the XRISM FoV provided by Hiromasa.
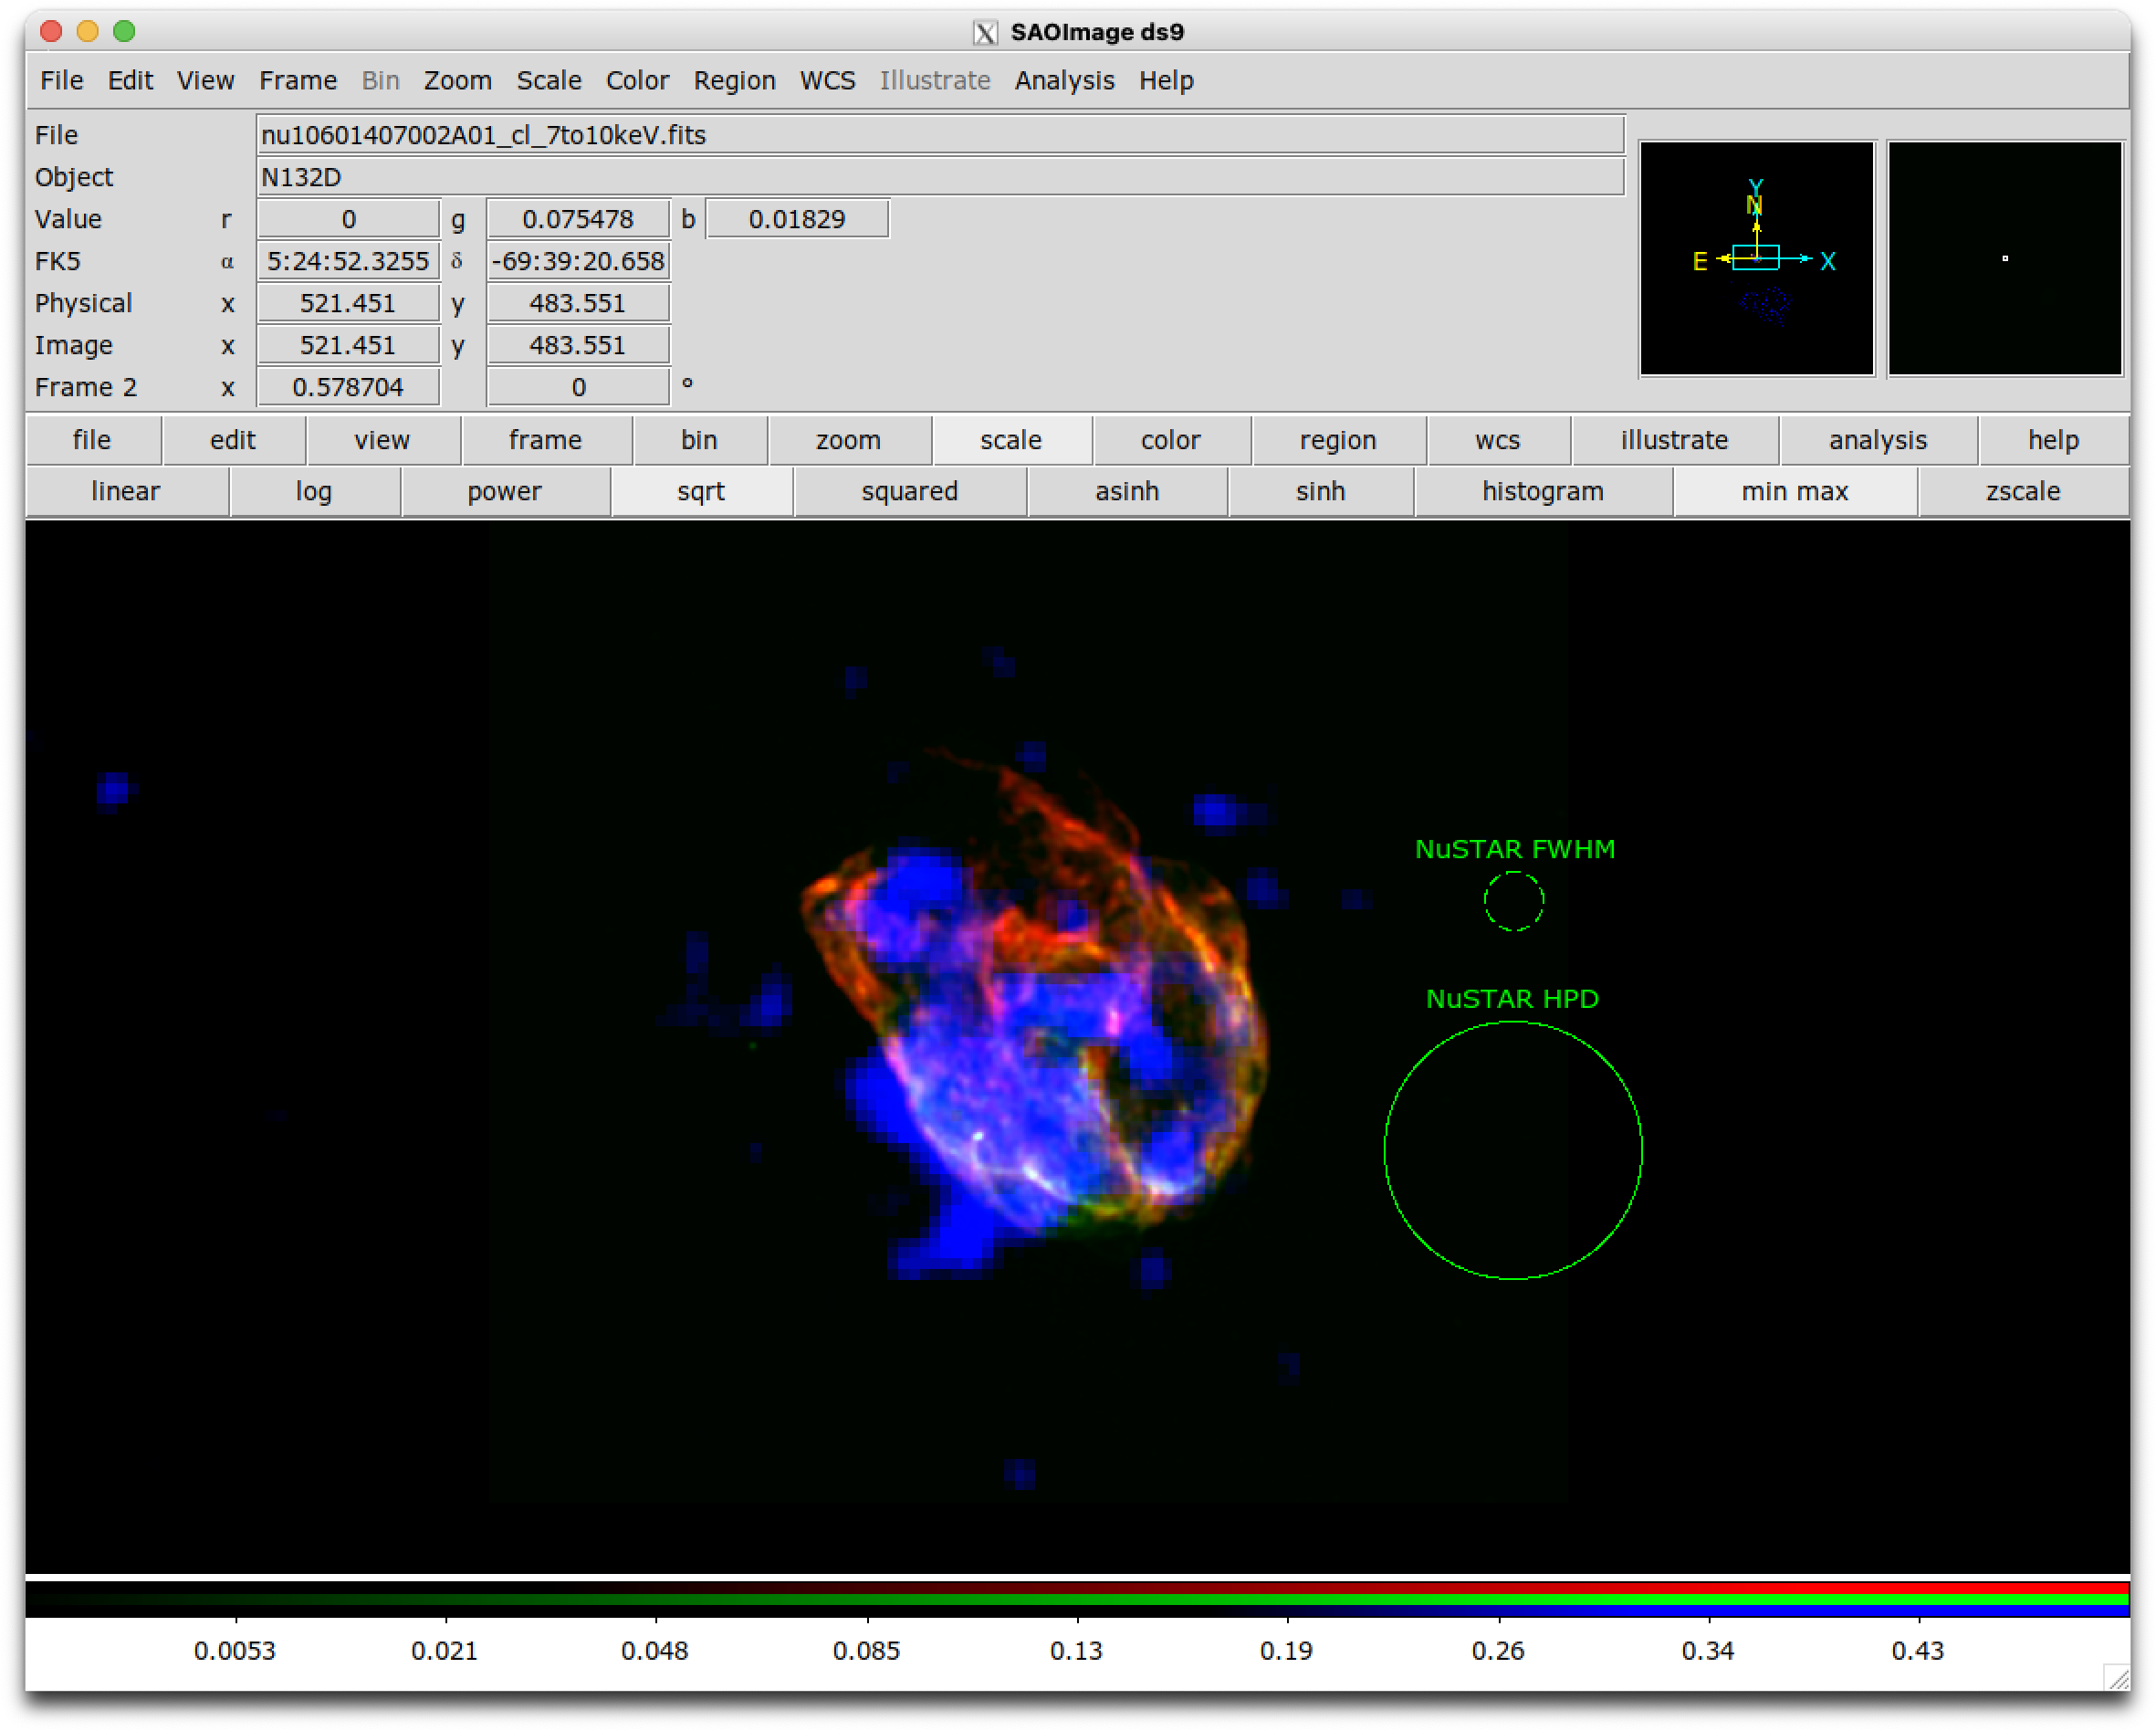
Below shows just an example, where here we show the 2020 7-10 keV NuSTAR data (blue), the Chandra soft (<0.7 keV) and hard (0.7-7 keV)
images in red and green along. The NuSTAR 7-10 keV data is largely dominated by the southern rim and is (likely, not proven yet) consistent
with originating entirely from the knots in the southern rim given the relatively poor PSF from NuSTAR.
Should check against the XMM hard images?