In the bottom of this page you find the spectra, responses and background files necessary to reproduce the spectral analysis in Kettula et al., 2013 (A&A, 552, 47) which yielded results summarised in Fig 1. The results correspond to public SUZAKU calibration information in June 2011, i.e. XIS CALDB release
20110608\ and XRT CALDB release 20080709\
Fig.1: The average relative difference (diamonds) +- the error of the mean of the temperatures for different instrument pairs using the public calibration in June 2011 (blue line) and the modified contaminate used in the paper (red line) in the soft band.
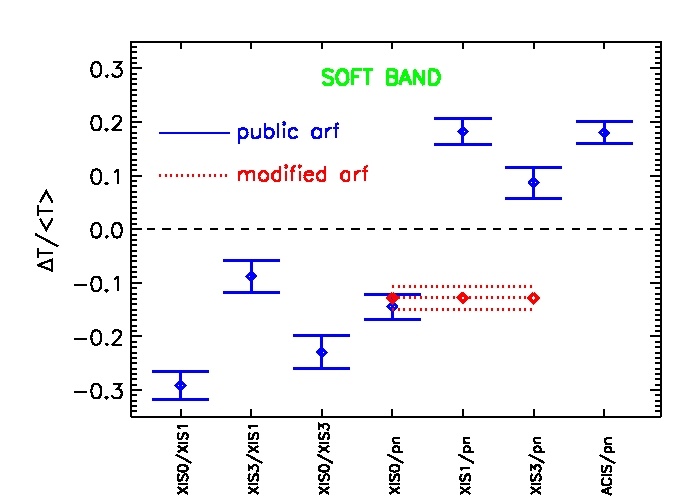
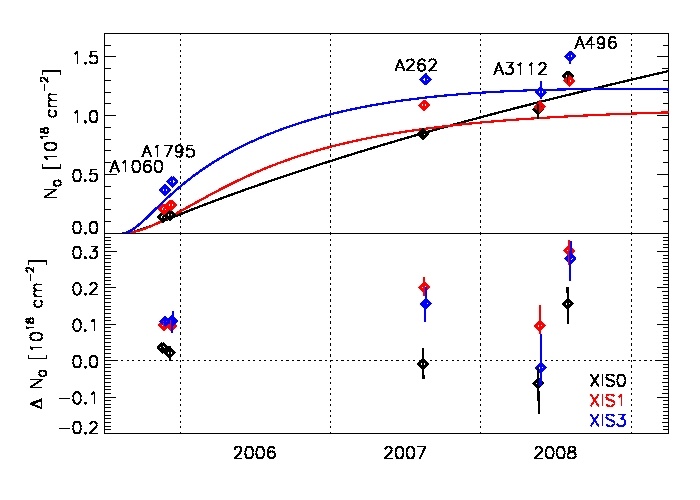
Fig.2: The total amount of the hydrogen column density of the contaminant obtained by the spectral fits to the 0.5-2.0 kev band data when requiring consistent temperatures between the different XIS instruments (upper panel) and its difference from that implemented in the public calibration (lower panel).
- SUZAKU data are processed with HEASoft3 release 6.11, containing Suzaku ftools version
18 (see details).
- XMM-Newton data are processed with xmmsas 20110223 1801-11.0.0 (see details).
- The spectra are extracted from 3-6 arcmin annulus, centered on the cluster center
- The scripts use a 1-temperature phabs x mekal model.
- The column density is from Kalberla et al. (2005) and the absorption cross-sections are from Balucinska-Church & McCammon (1992).
- The scripts use the metal abundance table from Grevesse & Sauval (1998).
INDIVIDUAL FITS
(Each cluster and instrument fitted separately, see Table A.1 in Kettula et al., 2013)
*Cluster* *Instrument*
A1060 Suzaku/XIS0 Suzaku/XIS1 Suzaku/XIS3
A1795 Suzaku/XIS0 Suzaku/XIS1 Suzaku/XIS3
A262 Suzaku/XIS0 Suzaku/XIS1 Suzaku/XIS3
A3112 Suzaku/XIS0 Suzaku/XIS1 Suzaku/XIS3
A496 Suzaku/XIS0 Suzaku/XIS1 Suzaku/XIS3
AWM7 Suzaku/XIS0 Suzaku/XIS1 Suzaku/XIS3
Centaurus Suzaku/XIS0 Suzaku/XIS1 Suzaku/XIS3
Coma Suzaku/XIS0 Suzaku/XIS1 Suzaku/XIS3
Ophiuchus Suzaku/XIS0 Suzaku/XIS1 Suzaku/XIS3
Triangulum Suzaku/XIS0 Suzaku/XIS1 Suzaku/XIS3
The script files xisX_Y_3_6_am_circ_newcal_Z_mekalfit.xcm will set up the best fit. In more detail:
- "X" refers to XIS unit (0,1, or 3)
- "Y" is the cluster name
- "Z" refers to the band used in the fit (0520 = 0.5-2.0 keV; 2070 = 2.0-7.0 keV
JOINT FIT
(For each cluster all XIS instruments fitted simultaneously, allowing Oxygen column density of the contaminant to vary, see Tables 5 and 6 in Kettula et al., 2013)
Download and unpack the following files into the same directory:
Part1
Part2
Part3
Part4
Part5
Part6
Running XSPEC script do_mekalfit_simult_modcon.xcm performs the spectral fits and produces
log files of the fit procedure mekalfit_simult_modcon_Y.log
XSPEC session files mekalfit_simult_modcon_Y.xcm
and plots mekalfit_simult_modcon_Y.ps
of the best fits, where Y is the cluster name.
The local model for the contaminant (hcorat) is included in the distribution and will be set up automatically, provided your XSPEC has been installed from the source.